Catenibacterium sp. CAG:290
Taxonomy: cellular organisms; Bacteria; Terrabacteria group; Firmicutes; Erysipelotrichia; Erysipelotrichales; Coprobacillaceae; Catenibacterium; environmental samples
Average proteome isoelectric point is 6.18
Get precalculated fractions of proteins
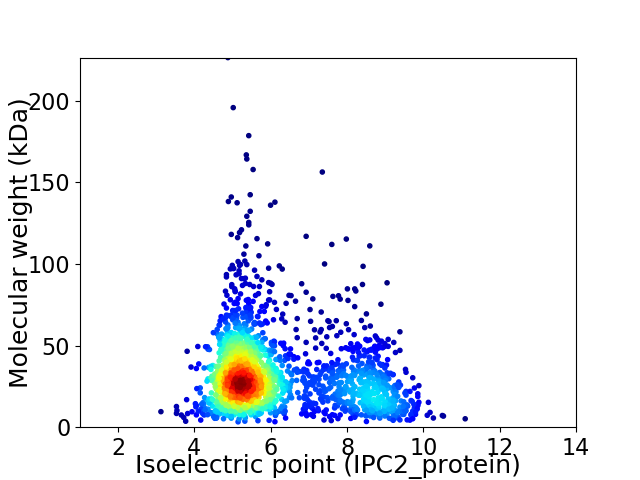
Virtual 2D-PAGE plot for 1992 proteins (isoelectric point calculated using IPC2_protein)
Get csv file with sequences according to given criteria:
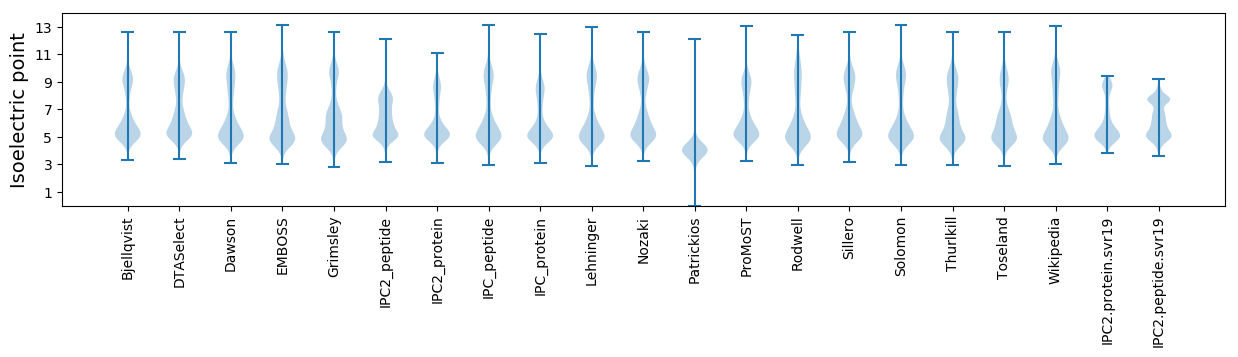
* You can choose from 21 different methods for calculating isoelectric point
Summary statistics related to proteome-wise predictions
Protein with the lowest isoelectric point:
>tr|R7GQI0|R7GQI0_9FIRM Uncharacterized protein OS=Catenibacterium sp. CAG:290 OX=1262767 GN=BN591_01338 PE=3 SV=1
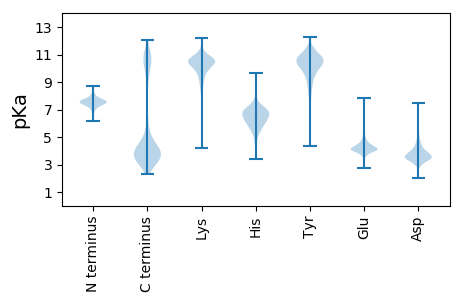
MM1 pKa = 7.22KK2 pKa = 10.57VKK4 pKa = 10.66VNEE7 pKa = 4.27GCLGCGACTGICPDD21 pKa = 3.53VFEE24 pKa = 6.54LDD26 pKa = 3.89DD27 pKa = 4.26EE28 pKa = 4.81GLAKK32 pKa = 10.68VIVEE36 pKa = 4.21EE37 pKa = 4.55TEE39 pKa = 4.09DD40 pKa = 4.08PAVQDD45 pKa = 5.45AIDD48 pKa = 4.13GCPVGVIEE56 pKa = 5.94AEE58 pKa = 4.02
MM1 pKa = 7.22KK2 pKa = 10.57VKK4 pKa = 10.66VNEE7 pKa = 4.27GCLGCGACTGICPDD21 pKa = 3.53VFEE24 pKa = 6.54LDD26 pKa = 3.89DD27 pKa = 4.26EE28 pKa = 4.81GLAKK32 pKa = 10.68VIVEE36 pKa = 4.21EE37 pKa = 4.55TEE39 pKa = 4.09DD40 pKa = 4.08PAVQDD45 pKa = 5.45AIDD48 pKa = 4.13GCPVGVIEE56 pKa = 5.94AEE58 pKa = 4.02
Molecular weight: 6.0 kDa
Isoelectric point according different methods:
Protein with the highest isoelectric point:
>tr|R7GNI2|R7GNI2_9FIRM 30S ribosomal protein S17 OS=Catenibacterium sp. CAG:290 OX=1262767 GN=rpsQ PE=3 SV=1
MM1 pKa = 7.35KK2 pKa = 9.42RR3 pKa = 11.84TYY5 pKa = 10.34QPNKK9 pKa = 8.62RR10 pKa = 11.84KK11 pKa = 9.56RR12 pKa = 11.84AKK14 pKa = 8.76THH16 pKa = 5.23GFRR19 pKa = 11.84ARR21 pKa = 11.84MATVGGRR28 pKa = 11.84KK29 pKa = 9.34VIARR33 pKa = 11.84RR34 pKa = 11.84RR35 pKa = 11.84KK36 pKa = 8.99KK37 pKa = 10.04GRR39 pKa = 11.84KK40 pKa = 8.66VLSAA44 pKa = 4.05
MM1 pKa = 7.35KK2 pKa = 9.42RR3 pKa = 11.84TYY5 pKa = 10.34QPNKK9 pKa = 8.62RR10 pKa = 11.84KK11 pKa = 9.56RR12 pKa = 11.84AKK14 pKa = 8.76THH16 pKa = 5.23GFRR19 pKa = 11.84ARR21 pKa = 11.84MATVGGRR28 pKa = 11.84KK29 pKa = 9.34VIARR33 pKa = 11.84RR34 pKa = 11.84RR35 pKa = 11.84KK36 pKa = 8.99KK37 pKa = 10.04GRR39 pKa = 11.84KK40 pKa = 8.66VLSAA44 pKa = 4.05
Molecular weight: 5.15 kDa
Isoelectric point according different methods:
Peptides (in silico digests for buttom-up proteomics)
Below you can find in silico digests of the whole proteome with Trypsin, Chymotrypsin, Trypsin+LysC, LysN, ArgC proteases suitable for different mass spec machines.| Try ESI |
 |
|---|
| ChTry ESI |
|
|---|
| ArgC ESI |
|
|---|
| LysN ESI |
|
|---|
| TryLysC ESI |
|
|---|
| Try MALDI |
|
|---|
| ChTry MALDI |
|
|---|
| ArgC MALDI |
|
|---|
| LysN MALDI |
|
|---|
| TryLysC MALDI |
|
|---|
| Try LTQ |
|
|---|
| ChTry LTQ |
|
|---|
| ArgC LTQ |
|
|---|
| LysN LTQ |
|
|---|
| TryLysC LTQ |
|
|---|
| Try MSlow |
|
|---|
| ChTry MSlow |
|
|---|
| ArgC MSlow |
|
|---|
| LysN MSlow |
|
|---|
| TryLysC MSlow |
|
|---|
| Try MShigh |
|
|---|
| ChTry MShigh |
|
|---|
| ArgC MShigh |
|
|---|
| LysN MShigh |
|
|---|
| TryLysC MShigh |
|
|---|
General Statistics
Number of major isoforms |
Number of additional isoforms |
Number of all proteins |
Number of amino acids |
Min. Seq. Length |
Max. Seq. Length |
Avg. Seq. Length |
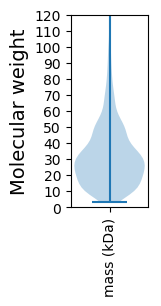
Avg. Mol. Weight |
|---|---|---|---|---|---|---|---|
0 |
591403 |
29 |
1942 |
296.9 |
33.61 |
Amino acid frequency
Ala |
Cys |
Asp |
Glu |
Phe |
Gly |
His |
Ile |
Lys |
Leu |
|---|---|---|---|---|---|---|---|---|---|
6.154 ± 0.061 | 1.379 ± 0.02 |
6.229 ± 0.051 | 7.014 ± 0.058 |
4.187 ± 0.041 | 6.295 ± 0.056 |
2.423 ± 0.03 | 8.258 ± 0.06 |
7.855 ± 0.054 | 9.143 ± 0.056 |
Met |
Asn |
Gln |
Pro |
Arg |
Ser |
Thr |
Val |
Trp |
Tyr |
|---|---|---|---|---|---|---|---|---|---|
3.057 ± 0.029 | 4.974 ± 0.039 |
3.091 ± 0.03 | 2.953 ± 0.026 |
3.532 ± 0.036 | 5.764 ± 0.045 |
5.511 ± 0.043 | 6.763 ± 0.045 |
0.663 ± 0.018 | 4.754 ± 0.045 |
Most of the basic statistics you can see at this page can be downloaded from this CSV file
See this proteome in:

Proteome-pI is available under Creative Commons Attribution-NoDerivs license, for more details see here
| Reference: Kozlowski LP. Proteome-pI 2.0: Proteome Isoelectric Point Database Update. Nucleic Acids Res. 2021, doi: 10.1093/nar/gkab944 | Contact: Lukasz P. Kozlowski |