Mycobacterium phage Saal
Taxonomy: Viruses; Duplodnaviria; Heunggongvirae; Uroviricota; Caudoviricetes; Caudovirales; Siphoviridae; Cheoctovirus; unclassified Cheoctovirus
Average proteome isoelectric point is 5.99
Get precalculated fractions of proteins
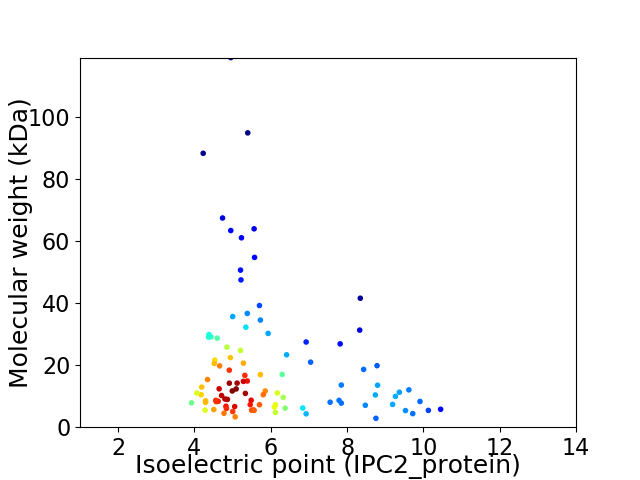
Virtual 2D-PAGE plot for 101 proteins (isoelectric point calculated using IPC2_protein)
Get csv file with sequences according to given criteria:
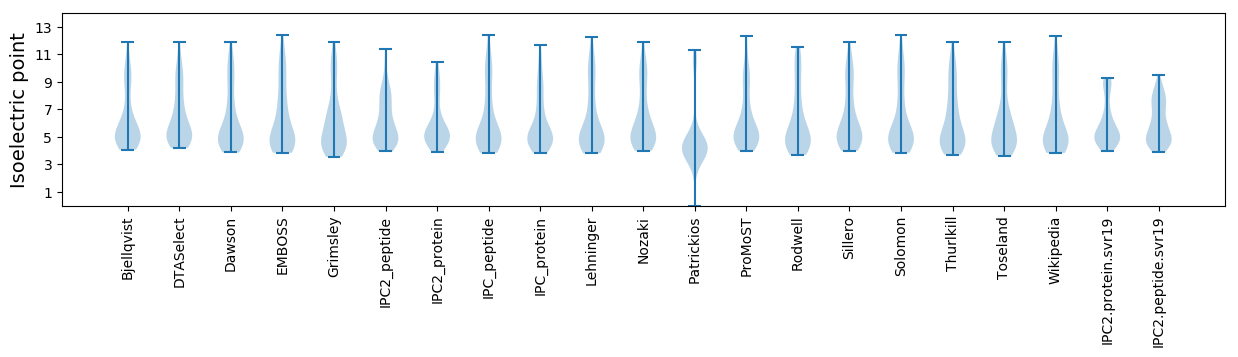
* You can choose from 21 different methods for calculating isoelectric point
Summary statistics related to proteome-wise predictions
Protein with the lowest isoelectric point:
>tr|W6AU68|W6AU68_9CAUD Uncharacterized protein OS=Mycobacterium phage Saal OX=1445728 GN=77 PE=4 SV=1
MM1 pKa = 7.71SDD3 pKa = 5.03CLLCDD8 pKa = 3.92HH9 pKa = 7.15PRR11 pKa = 11.84STHH14 pKa = 4.44TPEE17 pKa = 3.71CRR19 pKa = 11.84VRR21 pKa = 11.84MGIDD25 pKa = 3.58PDD27 pKa = 4.04DD28 pKa = 3.79MSVYY32 pKa = 8.7TACLCPGWEE41 pKa = 4.2GTKK44 pKa = 10.64DD45 pKa = 3.58GEE47 pKa = 4.15EE48 pKa = 4.21DD49 pKa = 3.16
MM1 pKa = 7.71SDD3 pKa = 5.03CLLCDD8 pKa = 3.92HH9 pKa = 7.15PRR11 pKa = 11.84STHH14 pKa = 4.44TPEE17 pKa = 3.71CRR19 pKa = 11.84VRR21 pKa = 11.84MGIDD25 pKa = 3.58PDD27 pKa = 4.04DD28 pKa = 3.79MSVYY32 pKa = 8.7TACLCPGWEE41 pKa = 4.2GTKK44 pKa = 10.64DD45 pKa = 3.58GEE47 pKa = 4.15EE48 pKa = 4.21DD49 pKa = 3.16
Molecular weight: 5.47 kDa
Isoelectric point according different methods:
Protein with the highest isoelectric point:
>tr|W6AU31|W6AU31_9CAUD Holin OS=Mycobacterium phage Saal OX=1445728 GN=32 PE=4 SV=1
MM1 pKa = 7.29NKK3 pKa = 9.07IHH5 pKa = 6.77IASHH9 pKa = 6.72GPAGWNATILFTAGTVLTVSDD30 pKa = 3.74DD31 pKa = 3.36QGRR34 pKa = 11.84KK35 pKa = 9.22HH36 pKa = 6.79LIDD39 pKa = 3.4TSRR42 pKa = 11.84VTVRR46 pKa = 11.84RR47 pKa = 11.84LSS49 pKa = 3.31
MM1 pKa = 7.29NKK3 pKa = 9.07IHH5 pKa = 6.77IASHH9 pKa = 6.72GPAGWNATILFTAGTVLTVSDD30 pKa = 3.74DD31 pKa = 3.36QGRR34 pKa = 11.84KK35 pKa = 9.22HH36 pKa = 6.79LIDD39 pKa = 3.4TSRR42 pKa = 11.84VTVRR46 pKa = 11.84RR47 pKa = 11.84LSS49 pKa = 3.31
Molecular weight: 5.34 kDa
Isoelectric point according different methods:
Peptides (in silico digests for buttom-up proteomics)
Below you can find in silico digests of the whole proteome with Trypsin, Chymotrypsin, Trypsin+LysC, LysN, ArgC proteases suitable for different mass spec machines.| Try ESI |
 |
|---|
| ChTry ESI |
|
|---|
| ArgC ESI |
|
|---|
| LysN ESI |
|
|---|
| TryLysC ESI |
|
|---|
| Try MALDI |
|
|---|
| ChTry MALDI |
|
|---|
| ArgC MALDI |
|
|---|
| LysN MALDI |
|
|---|
| TryLysC MALDI |
|
|---|
| Try LTQ |
|
|---|
| ChTry LTQ |
|
|---|
| ArgC LTQ |
|
|---|
| LysN LTQ |
|
|---|
| TryLysC LTQ |
|
|---|
| Try MSlow |
|
|---|
| ChTry MSlow |
|
|---|
| ArgC MSlow |
|
|---|
| LysN MSlow |
|
|---|
| TryLysC MSlow |
|
|---|
| Try MShigh |
|
|---|
| ChTry MShigh |
|
|---|
| ArgC MShigh |
|
|---|
| LysN MShigh |
|
|---|
| TryLysC MShigh |
|
|---|
General Statistics
Number of major isoforms |
Number of additional isoforms |
Number of all proteins |
Number of amino acids |
Min. Seq. Length |
Max. Seq. Length |
Avg. Seq. Length |
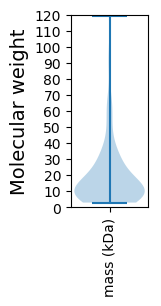
Avg. Mol. Weight |
|---|---|---|---|---|---|---|---|
0 |
18296 |
25 |
1173 |
181.1 |
19.84 |
Amino acid frequency
Ala |
Cys |
Asp |
Glu |
Phe |
Gly |
His |
Ile |
Lys |
Leu |
|---|---|---|---|---|---|---|---|---|---|
10.407 ± 0.475 | 1.137 ± 0.16 |
6.745 ± 0.226 | 6.018 ± 0.284 |
3.115 ± 0.189 | 8.696 ± 0.637 |
2.252 ± 0.216 | 4.383 ± 0.175 |
3.389 ± 0.187 | 7.297 ± 0.226 |
Met |
Asn |
Gln |
Pro |
Arg |
Ser |
Thr |
Val |
Trp |
Tyr |
|---|---|---|---|---|---|---|---|---|---|
2.361 ± 0.135 | 3.422 ± 0.174 |
6.012 ± 0.201 | 3.4 ± 0.193 |
6.799 ± 0.386 | 5.99 ± 0.327 |
6.581 ± 0.249 | 7.253 ± 0.28 |
2.159 ± 0.146 | 2.585 ± 0.159 |
Most of the basic statistics you can see at this page can be downloaded from this CSV file
See this proteome in:

Proteome-pI is available under Creative Commons Attribution-NoDerivs license, for more details see here
| Reference: Kozlowski LP. Proteome-pI 2.0: Proteome Isoelectric Point Database Update. Nucleic Acids Res. 2021, doi: 10.1093/nar/gkab944 | Contact: Lukasz P. Kozlowski |