Tolypothrix sp. NIES-4075
Taxonomy: cellular organisms; Bacteria; Terrabacteria group; Cyanobacteria/Melainabacteria group; Cyanobacteria; Nostocales; Tolypothrichaceae; Tolypothrix; unclassified Tolypothrix
Average proteome isoelectric point is 6.53
Get precalculated fractions of proteins
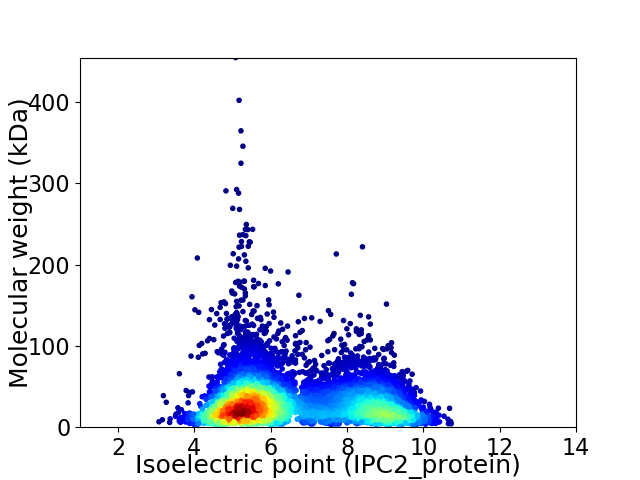
Virtual 2D-PAGE plot for 7285 proteins (isoelectric point calculated using IPC2_protein)
Get csv file with sequences according to given criteria:
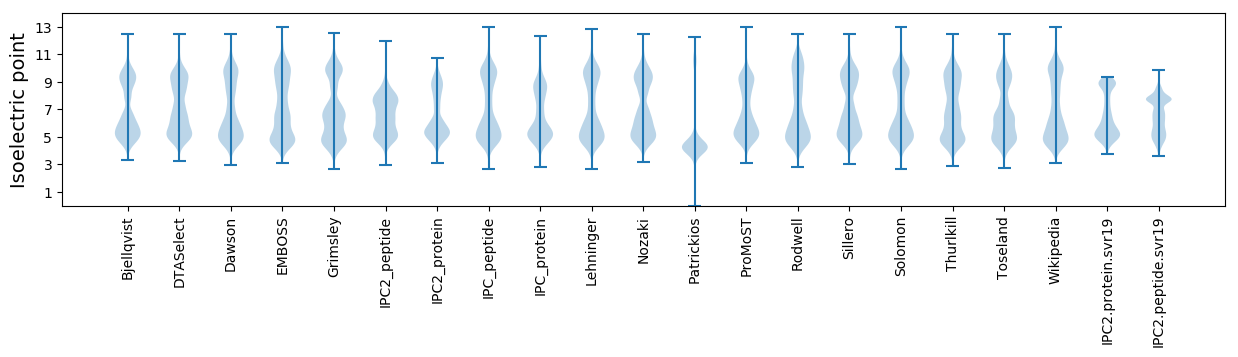
* You can choose from 21 different methods for calculating isoelectric point
Summary statistics related to proteome-wise predictions
Protein with the lowest isoelectric point:
>tr|A0A218QB29|A0A218QB29_9CYAN DUF3598 domain-containing protein OS=Tolypothrix sp. NIES-4075 OX=2005459 GN=NIES4075_00490 PE=3 SV=1
MM1 pKa = 7.47ALEE4 pKa = 3.99FDD6 pKa = 4.17YY7 pKa = 11.4NEE9 pKa = 4.1EE10 pKa = 3.85EE11 pKa = 4.29IYY13 pKa = 10.64PPFTGTEE20 pKa = 4.05FVANNEE26 pKa = 4.67TIDD29 pKa = 3.49SHH31 pKa = 6.81PYY33 pKa = 9.8AVAFGQFLGSGIHH46 pKa = 7.26PDD48 pKa = 3.53TANEE52 pKa = 4.03LAFGLHH58 pKa = 5.83SAISQISDD66 pKa = 3.48DD67 pKa = 4.38PFDD70 pKa = 3.93EE71 pKa = 4.28LRR73 pKa = 11.84VRR75 pKa = 11.84AVNIFDD81 pKa = 4.74RR82 pKa = 11.84LNEE85 pKa = 3.76MNYY88 pKa = 9.28WEE90 pKa = 4.87FSSSEE95 pKa = 4.38DD96 pKa = 4.7GDD98 pKa = 3.95HH99 pKa = 6.8QPDD102 pKa = 3.12NFVFTEE108 pKa = 4.02
MM1 pKa = 7.47ALEE4 pKa = 3.99FDD6 pKa = 4.17YY7 pKa = 11.4NEE9 pKa = 4.1EE10 pKa = 3.85EE11 pKa = 4.29IYY13 pKa = 10.64PPFTGTEE20 pKa = 4.05FVANNEE26 pKa = 4.67TIDD29 pKa = 3.49SHH31 pKa = 6.81PYY33 pKa = 9.8AVAFGQFLGSGIHH46 pKa = 7.26PDD48 pKa = 3.53TANEE52 pKa = 4.03LAFGLHH58 pKa = 5.83SAISQISDD66 pKa = 3.48DD67 pKa = 4.38PFDD70 pKa = 3.93EE71 pKa = 4.28LRR73 pKa = 11.84VRR75 pKa = 11.84AVNIFDD81 pKa = 4.74RR82 pKa = 11.84LNEE85 pKa = 3.76MNYY88 pKa = 9.28WEE90 pKa = 4.87FSSSEE95 pKa = 4.38DD96 pKa = 4.7GDD98 pKa = 3.95HH99 pKa = 6.8QPDD102 pKa = 3.12NFVFTEE108 pKa = 4.02
Molecular weight: 12.3 kDa
Isoelectric point according different methods:
Protein with the highest isoelectric point:
>tr|A0A218QQI8|A0A218QQI8_9CYAN Twitching motility protein PilT OS=Tolypothrix sp. NIES-4075 OX=2005459 GN=pilT_2 PE=3 SV=1
MM1 pKa = 7.68RR2 pKa = 11.84VILKK6 pKa = 9.85RR7 pKa = 11.84DD8 pKa = 3.22RR9 pKa = 11.84LLLFRR14 pKa = 11.84LVQNGGNKK22 pKa = 8.45ATISNTQKK30 pKa = 10.3PCISSFLNFADD41 pKa = 3.12IVVANATVNHH51 pKa = 6.96CDD53 pKa = 3.33DD54 pKa = 3.31MGRR57 pKa = 11.84ILRR60 pKa = 11.84EE61 pKa = 3.63AARR64 pKa = 11.84LVRR67 pKa = 11.84PGGLLFTDD75 pKa = 3.74QDD77 pKa = 4.08PQRR80 pKa = 11.84SAWNFKK86 pKa = 10.61GFGLFLRR93 pKa = 11.84DD94 pKa = 2.83IRR96 pKa = 11.84YY97 pKa = 10.1SFMCIARR104 pKa = 11.84RR105 pKa = 11.84NYY107 pKa = 10.37
MM1 pKa = 7.68RR2 pKa = 11.84VILKK6 pKa = 9.85RR7 pKa = 11.84DD8 pKa = 3.22RR9 pKa = 11.84LLLFRR14 pKa = 11.84LVQNGGNKK22 pKa = 8.45ATISNTQKK30 pKa = 10.3PCISSFLNFADD41 pKa = 3.12IVVANATVNHH51 pKa = 6.96CDD53 pKa = 3.33DD54 pKa = 3.31MGRR57 pKa = 11.84ILRR60 pKa = 11.84EE61 pKa = 3.63AARR64 pKa = 11.84LVRR67 pKa = 11.84PGGLLFTDD75 pKa = 3.74QDD77 pKa = 4.08PQRR80 pKa = 11.84SAWNFKK86 pKa = 10.61GFGLFLRR93 pKa = 11.84DD94 pKa = 2.83IRR96 pKa = 11.84YY97 pKa = 10.1SFMCIARR104 pKa = 11.84RR105 pKa = 11.84NYY107 pKa = 10.37
Molecular weight: 12.3 kDa
Isoelectric point according different methods:
Peptides (in silico digests for buttom-up proteomics)
Below you can find in silico digests of the whole proteome with Trypsin, Chymotrypsin, Trypsin+LysC, LysN, ArgC proteases suitable for different mass spec machines.| Try ESI |
 |
|---|
| ChTry ESI |
|
|---|
| ArgC ESI |
|
|---|
| LysN ESI |
|
|---|
| TryLysC ESI |
|
|---|
| Try MALDI |
|
|---|
| ChTry MALDI |
|
|---|
| ArgC MALDI |
|
|---|
| LysN MALDI |
|
|---|
| TryLysC MALDI |
|
|---|
| Try LTQ |
|
|---|
| ChTry LTQ |
|
|---|
| ArgC LTQ |
|
|---|
| LysN LTQ |
|
|---|
| TryLysC LTQ |
|
|---|
| Try MSlow |
|
|---|
| ChTry MSlow |
|
|---|
| ArgC MSlow |
|
|---|
| LysN MSlow |
|
|---|
| TryLysC MSlow |
|
|---|
| Try MShigh |
|
|---|
| ChTry MShigh |
|
|---|
| ArgC MShigh |
|
|---|
| LysN MShigh |
|
|---|
| TryLysC MShigh |
|
|---|
General Statistics
Number of major isoforms |
Number of additional isoforms |
Number of all proteins |
Number of amino acids |
Min. Seq. Length |
Max. Seq. Length |
Avg. Seq. Length |
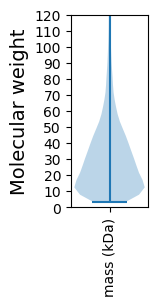
Avg. Mol. Weight |
|---|---|---|---|---|---|---|---|
0 |
2192051 |
29 |
4039 |
300.9 |
33.56 |
Amino acid frequency
Ala |
Cys |
Asp |
Glu |
Phe |
Gly |
His |
Ile |
Lys |
Leu |
|---|---|---|---|---|---|---|---|---|---|
8.092 ± 0.035 | 1.025 ± 0.01 |
4.823 ± 0.02 | 6.185 ± 0.031 |
3.989 ± 0.022 | 6.506 ± 0.034 |
1.806 ± 0.013 | 6.77 ± 0.024 |
5.206 ± 0.03 | 10.882 ± 0.04 |
Met |
Asn |
Gln |
Pro |
Arg |
Ser |
Thr |
Val |
Trp |
Tyr |
|---|---|---|---|---|---|---|---|---|---|
1.857 ± 0.014 | 4.573 ± 0.022 |
4.609 ± 0.022 | 5.266 ± 0.028 |
5.072 ± 0.021 | 6.608 ± 0.027 |
5.673 ± 0.025 | 6.598 ± 0.025 |
1.391 ± 0.013 | 3.068 ± 0.02 |
Most of the basic statistics you can see at this page can be downloaded from this CSV file
See this proteome in:

Proteome-pI is available under Creative Commons Attribution-NoDerivs license, for more details see here
| Reference: Kozlowski LP. Proteome-pI 2.0: Proteome Isoelectric Point Database Update. Nucleic Acids Res. 2021, doi: 10.1093/nar/gkab944 | Contact: Lukasz P. Kozlowski |