American plum line pattern virus
Taxonomy: Viruses; Riboviria; Orthornavirae; Kitrinoviricota; Alsuviricetes; Martellivirales; Bromoviridae; Ilarvirus
Average proteome isoelectric point is 6.62
Get precalculated fractions of proteins
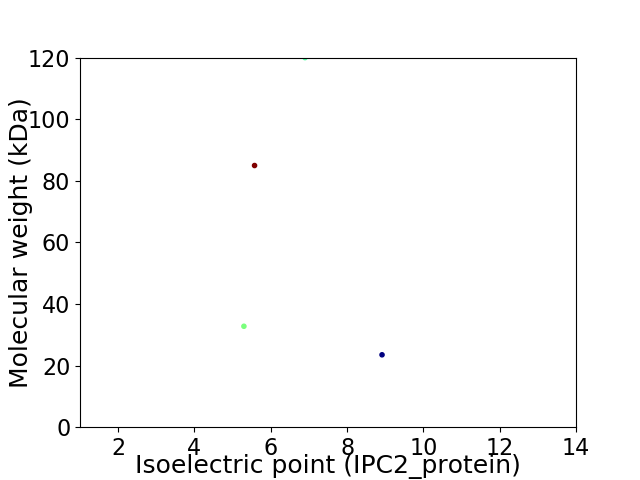
Virtual 2D-PAGE plot for 4 proteins (isoelectric point calculated using IPC2_protein)
Get csv file with sequences according to given criteria:
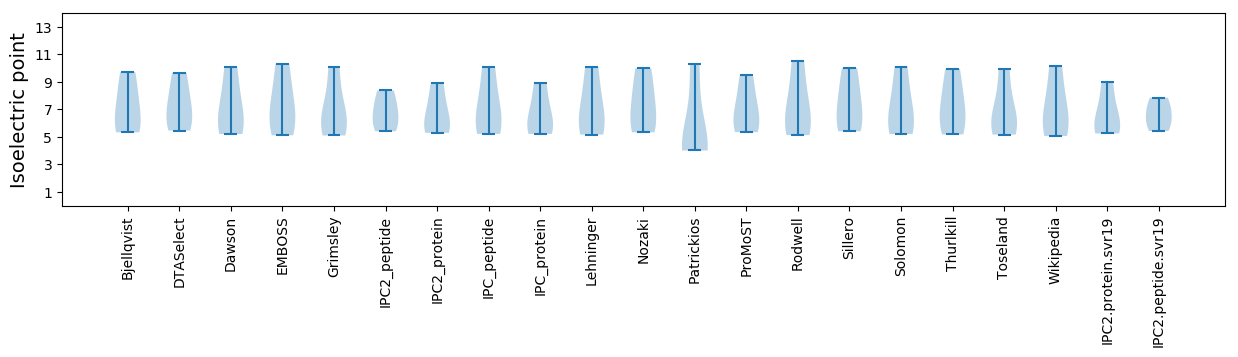
* You can choose from 21 different methods for calculating isoelectric point
Summary statistics related to proteome-wise predictions
Protein with the lowest isoelectric point:
>tr|Q997A3|Q997A3_9BROM RNA-directed RNA polymerase 2a OS=American plum line pattern virus OX=134632 PE=4 SV=1
MM1 pKa = 7.51AKK3 pKa = 9.77EE4 pKa = 4.15SSSGFSTRR12 pKa = 11.84VTSRR16 pKa = 11.84LDD18 pKa = 3.75AIAEE22 pKa = 3.97EE23 pKa = 4.72RR24 pKa = 11.84EE25 pKa = 3.76MDD27 pKa = 3.58EE28 pKa = 5.3FLDD31 pKa = 4.44FVTKK35 pKa = 10.75SPIKK39 pKa = 10.6QKK41 pKa = 9.38MCCDD45 pKa = 3.34IPLKK49 pKa = 10.34NSEE52 pKa = 4.21MLSFVNLVTKK62 pKa = 10.24EE63 pKa = 4.28SKK65 pKa = 10.77SFLSLFKK72 pKa = 10.63KK73 pKa = 10.08IPVYY77 pKa = 10.22TNHH80 pKa = 7.14PLISVIYY87 pKa = 9.81IPVVLNDD94 pKa = 3.77APGVLDD100 pKa = 3.58VALVNPITRR109 pKa = 11.84DD110 pKa = 3.16RR111 pKa = 11.84RR112 pKa = 11.84EE113 pKa = 4.03ILCNWPLSKK122 pKa = 10.72AVLVMTNWTRR132 pKa = 11.84SIAKK136 pKa = 9.78GAEE139 pKa = 3.78LNLAYY144 pKa = 9.7EE145 pKa = 4.39VSNTQVKK152 pKa = 10.35LDD154 pKa = 3.61QQIGRR159 pKa = 11.84FRR161 pKa = 11.84ILWADD166 pKa = 3.58VPSSKK171 pKa = 10.4QIYY174 pKa = 8.5EE175 pKa = 4.07KK176 pKa = 10.27EE177 pKa = 4.16RR178 pKa = 11.84PPMIVDD184 pKa = 4.39LEE186 pKa = 4.39EE187 pKa = 4.47TGCTMHH193 pKa = 6.75QYY195 pKa = 11.21SDD197 pKa = 3.35QTLLQFVNATMVSGVRR213 pKa = 11.84KK214 pKa = 9.05PRR216 pKa = 11.84EE217 pKa = 3.75DD218 pKa = 3.45RR219 pKa = 11.84KK220 pKa = 10.64LLRR223 pKa = 11.84LKK225 pKa = 10.32SLRR228 pKa = 11.84TGFEE232 pKa = 3.76IEE234 pKa = 4.08PAQDD238 pKa = 3.47DD239 pKa = 3.97EE240 pKa = 5.8ADD242 pKa = 3.67EE243 pKa = 4.66GKK245 pKa = 10.1KK246 pKa = 10.92GPIIVPSAPEE256 pKa = 3.62EE257 pKa = 3.73LHH259 pKa = 6.46RR260 pKa = 11.84PFVIEE265 pKa = 3.99GEE267 pKa = 4.45GVIGGPIMTVIEE279 pKa = 4.37FEE281 pKa = 5.16DD282 pKa = 4.11IAWHH286 pKa = 7.17LGDD289 pKa = 3.72QQ290 pKa = 3.8
MM1 pKa = 7.51AKK3 pKa = 9.77EE4 pKa = 4.15SSSGFSTRR12 pKa = 11.84VTSRR16 pKa = 11.84LDD18 pKa = 3.75AIAEE22 pKa = 3.97EE23 pKa = 4.72RR24 pKa = 11.84EE25 pKa = 3.76MDD27 pKa = 3.58EE28 pKa = 5.3FLDD31 pKa = 4.44FVTKK35 pKa = 10.75SPIKK39 pKa = 10.6QKK41 pKa = 9.38MCCDD45 pKa = 3.34IPLKK49 pKa = 10.34NSEE52 pKa = 4.21MLSFVNLVTKK62 pKa = 10.24EE63 pKa = 4.28SKK65 pKa = 10.77SFLSLFKK72 pKa = 10.63KK73 pKa = 10.08IPVYY77 pKa = 10.22TNHH80 pKa = 7.14PLISVIYY87 pKa = 9.81IPVVLNDD94 pKa = 3.77APGVLDD100 pKa = 3.58VALVNPITRR109 pKa = 11.84DD110 pKa = 3.16RR111 pKa = 11.84RR112 pKa = 11.84EE113 pKa = 4.03ILCNWPLSKK122 pKa = 10.72AVLVMTNWTRR132 pKa = 11.84SIAKK136 pKa = 9.78GAEE139 pKa = 3.78LNLAYY144 pKa = 9.7EE145 pKa = 4.39VSNTQVKK152 pKa = 10.35LDD154 pKa = 3.61QQIGRR159 pKa = 11.84FRR161 pKa = 11.84ILWADD166 pKa = 3.58VPSSKK171 pKa = 10.4QIYY174 pKa = 8.5EE175 pKa = 4.07KK176 pKa = 10.27EE177 pKa = 4.16RR178 pKa = 11.84PPMIVDD184 pKa = 4.39LEE186 pKa = 4.39EE187 pKa = 4.47TGCTMHH193 pKa = 6.75QYY195 pKa = 11.21SDD197 pKa = 3.35QTLLQFVNATMVSGVRR213 pKa = 11.84KK214 pKa = 9.05PRR216 pKa = 11.84EE217 pKa = 3.75DD218 pKa = 3.45RR219 pKa = 11.84KK220 pKa = 10.64LLRR223 pKa = 11.84LKK225 pKa = 10.32SLRR228 pKa = 11.84TGFEE232 pKa = 3.76IEE234 pKa = 4.08PAQDD238 pKa = 3.47DD239 pKa = 3.97EE240 pKa = 5.8ADD242 pKa = 3.67EE243 pKa = 4.66GKK245 pKa = 10.1KK246 pKa = 10.92GPIIVPSAPEE256 pKa = 3.62EE257 pKa = 3.73LHH259 pKa = 6.46RR260 pKa = 11.84PFVIEE265 pKa = 3.99GEE267 pKa = 4.45GVIGGPIMTVIEE279 pKa = 4.37FEE281 pKa = 5.16DD282 pKa = 4.11IAWHH286 pKa = 7.17LGDD289 pKa = 3.72QQ290 pKa = 3.8
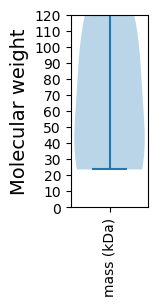
Molecular weight: 32.76 kDa
Isoelectric point according different methods:
Protein with the highest isoelectric point:
>tr|Q997A2|Q997A2_9BROM Movement protein OS=American plum line pattern virus OX=134632 PE=4 SV=1
MM1 pKa = 7.64LKK3 pKa = 9.89MNAPQNKK10 pKa = 9.01GKK12 pKa = 10.44KK13 pKa = 8.24KK14 pKa = 9.72QNARR18 pKa = 11.84TTQFAQRR25 pKa = 11.84RR26 pKa = 11.84AAAARR31 pKa = 11.84GEE33 pKa = 4.31IEE35 pKa = 4.05TSSRR39 pKa = 11.84NITARR44 pKa = 11.84SGGPPVPRR52 pKa = 11.84SIRR55 pKa = 11.84TEE57 pKa = 3.77WEE59 pKa = 3.7LVGPSVGARR68 pKa = 11.84LIQGPHH74 pKa = 5.4NEE76 pKa = 4.26VVKK79 pKa = 11.07GEE81 pKa = 4.11AVASSTTAGQYY92 pKa = 10.45FSIQISTYY100 pKa = 9.57LEE102 pKa = 4.14KK103 pKa = 10.41FLEE106 pKa = 4.35MGVQLNSMTVLCASLQGSGIVCLTHH131 pKa = 7.59KK132 pKa = 9.31FTTCEE137 pKa = 3.7AAISTLSGLRR147 pKa = 11.84FRR149 pKa = 11.84EE150 pKa = 4.14GRR152 pKa = 11.84RR153 pKa = 11.84LGFQVLPPSDD163 pKa = 3.47TVAGDD168 pKa = 3.23VASNVRR174 pKa = 11.84LVFKK178 pKa = 10.48FDD180 pKa = 3.44KK181 pKa = 10.85AFEE184 pKa = 4.52ANAPLIEE191 pKa = 4.16RR192 pKa = 11.84KK193 pKa = 9.74VWVSTSRR200 pKa = 11.84LPEE203 pKa = 3.46IMIPANLLVPDD214 pKa = 4.32EE215 pKa = 4.57DD216 pKa = 3.82
MM1 pKa = 7.64LKK3 pKa = 9.89MNAPQNKK10 pKa = 9.01GKK12 pKa = 10.44KK13 pKa = 8.24KK14 pKa = 9.72QNARR18 pKa = 11.84TTQFAQRR25 pKa = 11.84RR26 pKa = 11.84AAAARR31 pKa = 11.84GEE33 pKa = 4.31IEE35 pKa = 4.05TSSRR39 pKa = 11.84NITARR44 pKa = 11.84SGGPPVPRR52 pKa = 11.84SIRR55 pKa = 11.84TEE57 pKa = 3.77WEE59 pKa = 3.7LVGPSVGARR68 pKa = 11.84LIQGPHH74 pKa = 5.4NEE76 pKa = 4.26VVKK79 pKa = 11.07GEE81 pKa = 4.11AVASSTTAGQYY92 pKa = 10.45FSIQISTYY100 pKa = 9.57LEE102 pKa = 4.14KK103 pKa = 10.41FLEE106 pKa = 4.35MGVQLNSMTVLCASLQGSGIVCLTHH131 pKa = 7.59KK132 pKa = 9.31FTTCEE137 pKa = 3.7AAISTLSGLRR147 pKa = 11.84FRR149 pKa = 11.84EE150 pKa = 4.14GRR152 pKa = 11.84RR153 pKa = 11.84LGFQVLPPSDD163 pKa = 3.47TVAGDD168 pKa = 3.23VASNVRR174 pKa = 11.84LVFKK178 pKa = 10.48FDD180 pKa = 3.44KK181 pKa = 10.85AFEE184 pKa = 4.52ANAPLIEE191 pKa = 4.16RR192 pKa = 11.84KK193 pKa = 9.74VWVSTSRR200 pKa = 11.84LPEE203 pKa = 3.46IMIPANLLVPDD214 pKa = 4.32EE215 pKa = 4.57DD216 pKa = 3.82
Molecular weight: 23.5 kDa
Isoelectric point according different methods:
Peptides (in silico digests for buttom-up proteomics)
Below you can find in silico digests of the whole proteome with Trypsin, Chymotrypsin, Trypsin+LysC, LysN, ArgC proteases suitable for different mass spec machines.| Try ESI |
 |
|---|
| ChTry ESI |
|
|---|
| ArgC ESI |
|
|---|
| LysN ESI |
|
|---|
| TryLysC ESI |
|
|---|
| Try MALDI |
|
|---|
| ChTry MALDI |
|
|---|
| ArgC MALDI |
|
|---|
| LysN MALDI |
|
|---|
| TryLysC MALDI |
|
|---|
| Try LTQ |
|
|---|
| ChTry LTQ |
|
|---|
| ArgC LTQ |
|
|---|
| LysN LTQ |
|
|---|
| TryLysC LTQ |
|
|---|
| Try MSlow |
|
|---|
| ChTry MSlow |
|
|---|
| ArgC MSlow |
|
|---|
| LysN MSlow |
|
|---|
| TryLysC MSlow |
|
|---|
| Try MShigh |
|
|---|
| ChTry MShigh |
|
|---|
| ArgC MShigh |
|
|---|
| LysN MShigh |
|
|---|
| TryLysC MShigh |
|
|---|
General Statistics
Number of major isoforms |
Number of additional isoforms |
Number of all proteins |
Number of amino acids |
Min. Seq. Length |
Max. Seq. Length |
Avg. Seq. Length |
Avg. Mol. Weight |
|---|---|---|---|---|---|---|---|
0 |
2308 |
216 |
1062 |
577.0 |
65.3 |
Amino acid frequency
Ala |
Cys |
Asp |
Glu |
Phe |
Gly |
His |
Ile |
Lys |
Leu |
|---|---|---|---|---|---|---|---|---|---|
6.023 ± 0.767 | 2.21 ± 0.302 |
6.066 ± 0.706 | 6.586 ± 0.624 |
5.199 ± 0.603 | 5.069 ± 0.401 |
2.21 ± 0.355 | 5.156 ± 0.735 |
5.936 ± 0.128 | 8.925 ± 0.835 |
Met |
Asn |
Gln |
Pro |
Arg |
Ser |
Thr |
Val |
Trp |
Tyr |
|---|---|---|---|---|---|---|---|---|---|
2.08 ± 0.266 | 3.423 ± 0.478 |
4.809 ± 0.487 | 2.946 ± 0.334 |
6.326 ± 0.417 | 8.362 ± 0.357 |
5.719 ± 0.158 | 8.536 ± 0.196 |
1.213 ± 0.177 | 3.206 ± 0.606 |
Most of the basic statistics you can see at this page can be downloaded from this CSV file
See this proteome in:

Proteome-pI is available under Creative Commons Attribution-NoDerivs license, for more details see here
| Reference: Kozlowski LP. Proteome-pI 2.0: Proteome Isoelectric Point Database Update. Nucleic Acids Res. 2021, doi: 10.1093/nar/gkab944 | Contact: Lukasz P. Kozlowski |