Janthinobacterium sp. KBS0711
Taxonomy: cellular organisms; Bacteria; Proteobacteria; Betaproteobacteria; Burkholderiales; Oxalobacteraceae; Janthinobacterium; unclassified Janthinobacterium
Average proteome isoelectric point is 6.75
Get precalculated fractions of proteins
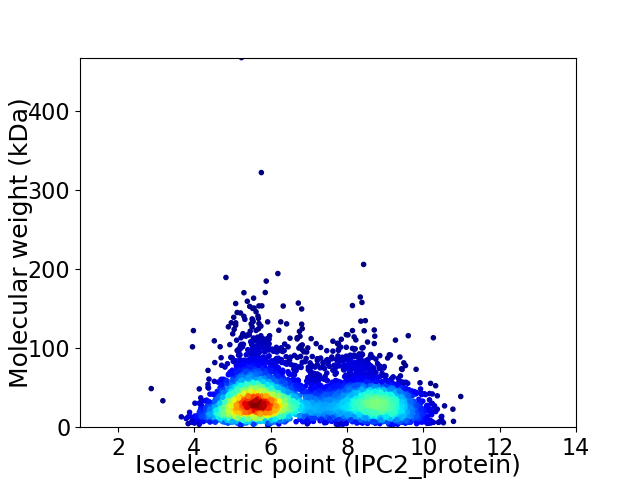
Virtual 2D-PAGE plot for 5384 proteins (isoelectric point calculated using IPC2_protein)
Get csv file with sequences according to given criteria:
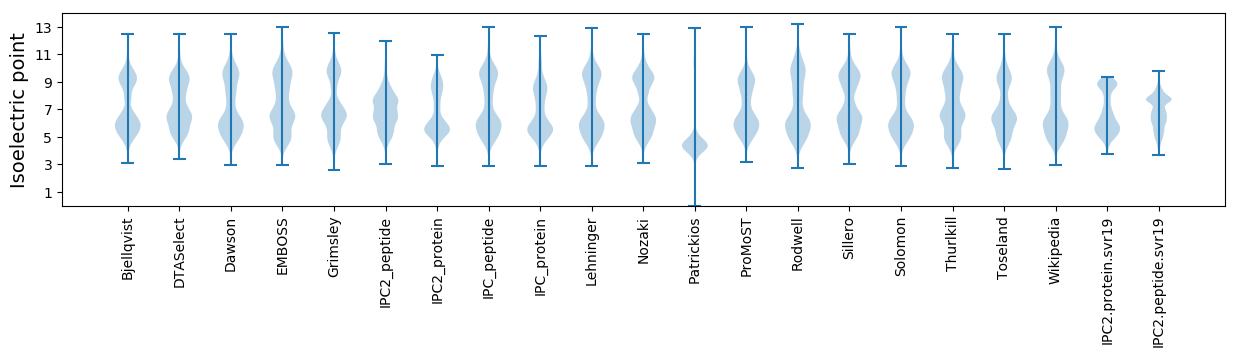
* You can choose from 21 different methods for calculating isoelectric point
Summary statistics related to proteome-wise predictions
Protein with the lowest isoelectric point:
>tr|A0A0M2WRK1|A0A0M2WRK1_9BURK Hca operon transcriptional activator OS=Janthinobacterium sp. KBS0711 OX=1649647 GN=hcaR_2 PE=3 SV=1
MM1 pKa = 7.1NAVAEE6 pKa = 4.3MQDD9 pKa = 4.15VIPSPIIFTDD19 pKa = 3.6SAAEE23 pKa = 4.01KK24 pKa = 9.59VAQLIEE30 pKa = 4.38EE31 pKa = 4.51EE32 pKa = 4.63GNPDD36 pKa = 2.85LKK38 pKa = 11.13LRR40 pKa = 11.84VFVQGGGCSGFQYY53 pKa = 10.94GFTFDD58 pKa = 4.69EE59 pKa = 4.93IVNEE63 pKa = 4.83DD64 pKa = 3.85DD65 pKa = 3.11TTMVKK70 pKa = 10.58NGVQLLIDD78 pKa = 3.77SMSYY82 pKa = 10.23QYY84 pKa = 11.55LVGAEE89 pKa = 4.01IDD91 pKa = 3.89YY92 pKa = 11.28KK93 pKa = 11.39DD94 pKa = 4.47DD95 pKa = 4.08LEE97 pKa = 4.56GAQFVIKK104 pKa = 10.68NPTATSTCGCGSSFSVV120 pKa = 3.54
MM1 pKa = 7.1NAVAEE6 pKa = 4.3MQDD9 pKa = 4.15VIPSPIIFTDD19 pKa = 3.6SAAEE23 pKa = 4.01KK24 pKa = 9.59VAQLIEE30 pKa = 4.38EE31 pKa = 4.51EE32 pKa = 4.63GNPDD36 pKa = 2.85LKK38 pKa = 11.13LRR40 pKa = 11.84VFVQGGGCSGFQYY53 pKa = 10.94GFTFDD58 pKa = 4.69EE59 pKa = 4.93IVNEE63 pKa = 4.83DD64 pKa = 3.85DD65 pKa = 3.11TTMVKK70 pKa = 10.58NGVQLLIDD78 pKa = 3.77SMSYY82 pKa = 10.23QYY84 pKa = 11.55LVGAEE89 pKa = 4.01IDD91 pKa = 3.89YY92 pKa = 11.28KK93 pKa = 11.39DD94 pKa = 4.47DD95 pKa = 4.08LEE97 pKa = 4.56GAQFVIKK104 pKa = 10.68NPTATSTCGCGSSFSVV120 pKa = 3.54
Molecular weight: 12.98 kDa
Isoelectric point according different methods:
Protein with the highest isoelectric point:
>tr|A0A0M2WPU7|A0A0M2WPU7_9BURK Inosine 5'-monophosphate dehydrogenase OS=Janthinobacterium sp. KBS0711 OX=1649647 GN=VM94_01574 PE=4 SV=1
MM1 pKa = 7.91PKK3 pKa = 9.63MKK5 pKa = 9.83TKK7 pKa = 10.72SSAKK11 pKa = 9.15KK12 pKa = 9.67RR13 pKa = 11.84FRR15 pKa = 11.84VRR17 pKa = 11.84PGGTVKK23 pKa = 10.48SGHH26 pKa = 5.47AFKK29 pKa = 10.85RR30 pKa = 11.84HH31 pKa = 5.44ILTKK35 pKa = 9.78KK36 pKa = 3.98TTKK39 pKa = 10.23NKK41 pKa = 9.21RR42 pKa = 11.84QLRR45 pKa = 11.84GTRR48 pKa = 11.84NINASDD54 pKa = 3.65VTSVMRR60 pKa = 11.84MMPTAA65 pKa = 4.09
MM1 pKa = 7.91PKK3 pKa = 9.63MKK5 pKa = 9.83TKK7 pKa = 10.72SSAKK11 pKa = 9.15KK12 pKa = 9.67RR13 pKa = 11.84FRR15 pKa = 11.84VRR17 pKa = 11.84PGGTVKK23 pKa = 10.48SGHH26 pKa = 5.47AFKK29 pKa = 10.85RR30 pKa = 11.84HH31 pKa = 5.44ILTKK35 pKa = 9.78KK36 pKa = 3.98TTKK39 pKa = 10.23NKK41 pKa = 9.21RR42 pKa = 11.84QLRR45 pKa = 11.84GTRR48 pKa = 11.84NINASDD54 pKa = 3.65VTSVMRR60 pKa = 11.84MMPTAA65 pKa = 4.09
Molecular weight: 7.38 kDa
Isoelectric point according different methods:
Peptides (in silico digests for buttom-up proteomics)
Below you can find in silico digests of the whole proteome with Trypsin, Chymotrypsin, Trypsin+LysC, LysN, ArgC proteases suitable for different mass spec machines.| Try ESI |
 |
|---|
| ChTry ESI |
|
|---|
| ArgC ESI |
|
|---|
| LysN ESI |
|
|---|
| TryLysC ESI |
|
|---|
| Try MALDI |
|
|---|
| ChTry MALDI |
|
|---|
| ArgC MALDI |
|
|---|
| LysN MALDI |
|
|---|
| TryLysC MALDI |
|
|---|
| Try LTQ |
|
|---|
| ChTry LTQ |
|
|---|
| ArgC LTQ |
|
|---|
| LysN LTQ |
|
|---|
| TryLysC LTQ |
|
|---|
| Try MSlow |
|
|---|
| ChTry MSlow |
|
|---|
| ArgC MSlow |
|
|---|
| LysN MSlow |
|
|---|
| TryLysC MSlow |
|
|---|
| Try MShigh |
|
|---|
| ChTry MShigh |
|
|---|
| ArgC MShigh |
|
|---|
| LysN MShigh |
|
|---|
| TryLysC MShigh |
|
|---|
General Statistics
Number of major isoforms |
Number of additional isoforms |
Number of all proteins |
Number of amino acids |
Min. Seq. Length |
Max. Seq. Length |
Avg. Seq. Length |
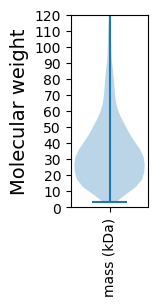
Avg. Mol. Weight |
|---|---|---|---|---|---|---|---|
0 |
1820683 |
29 |
4558 |
338.2 |
36.67 |
Amino acid frequency
Ala |
Cys |
Asp |
Glu |
Phe |
Gly |
His |
Ile |
Lys |
Leu |
|---|---|---|---|---|---|---|---|---|---|
12.81 ± 0.048 | 0.9 ± 0.01 |
5.278 ± 0.023 | 4.897 ± 0.031 |
3.549 ± 0.021 | 8.09 ± 0.037 |
2.218 ± 0.016 | 4.764 ± 0.027 |
3.629 ± 0.03 | 10.912 ± 0.044 |
Met |
Asn |
Gln |
Pro |
Arg |
Ser |
Thr |
Val |
Trp |
Tyr |
|---|---|---|---|---|---|---|---|---|---|
2.574 ± 0.017 | 2.976 ± 0.021 |
4.906 ± 0.027 | 4.334 ± 0.023 |
6.124 ± 0.034 | 5.693 ± 0.029 |
5.207 ± 0.027 | 7.197 ± 0.027 |
1.341 ± 0.014 | 2.566 ± 0.02 |
Most of the basic statistics you can see at this page can be downloaded from this CSV file
See this proteome in:

Proteome-pI is available under Creative Commons Attribution-NoDerivs license, for more details see here
| Reference: Kozlowski LP. Proteome-pI 2.0: Proteome Isoelectric Point Database Update. Nucleic Acids Res. 2021, doi: 10.1093/nar/gkab944 | Contact: Lukasz P. Kozlowski |