Lactobacillus rodentium
Taxonomy: cellular organisms; Bacteria; Terrabacteria group; Firmicutes; Bacilli; Lactobacillales; Lactobacillaceae; Lactobacillus
Average proteome isoelectric point is 6.92
Get precalculated fractions of proteins
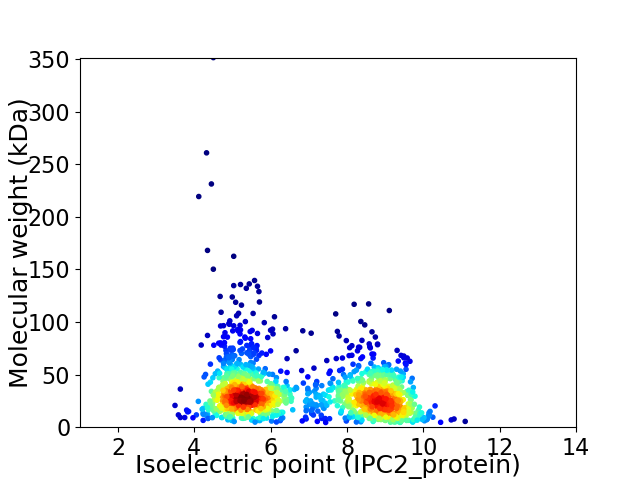
Virtual 2D-PAGE plot for 1434 proteins (isoelectric point calculated using IPC2_protein)
Get csv file with sequences according to given criteria:
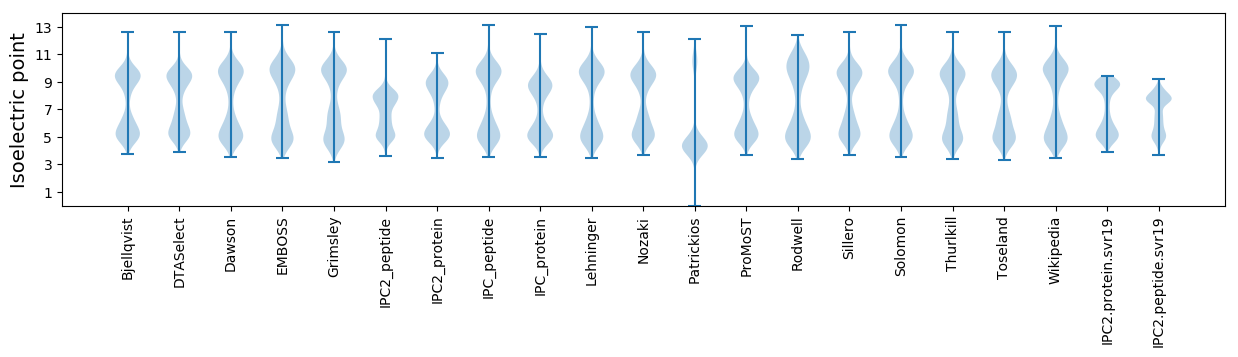
* You can choose from 21 different methods for calculating isoelectric point
Summary statistics related to proteome-wise predictions
Protein with the lowest isoelectric point:
>tr|A0A2Z6TG48|A0A2Z6TG48_9LACO DegV family protein OS=Lactobacillus rodentium OX=947835 GN=degV PE=4 SV=1
MM1 pKa = 7.78IIFITSITTYY11 pKa = 9.49TFDD14 pKa = 3.82FARR17 pKa = 11.84LLVDD21 pKa = 3.89MIEE24 pKa = 4.0NDD26 pKa = 2.95KK27 pKa = 11.02YY28 pKa = 11.3GYY30 pKa = 9.94YY31 pKa = 10.24HH32 pKa = 6.84ATNAEE37 pKa = 4.1LPDD40 pKa = 3.86TEE42 pKa = 4.99SDD44 pKa = 3.14HH45 pKa = 7.63DD46 pKa = 4.25EE47 pKa = 4.37NGTLRR52 pKa = 11.84LATFF56 pKa = 4.48
MM1 pKa = 7.78IIFITSITTYY11 pKa = 9.49TFDD14 pKa = 3.82FARR17 pKa = 11.84LLVDD21 pKa = 3.89MIEE24 pKa = 4.0NDD26 pKa = 2.95KK27 pKa = 11.02YY28 pKa = 11.3GYY30 pKa = 9.94YY31 pKa = 10.24HH32 pKa = 6.84ATNAEE37 pKa = 4.1LPDD40 pKa = 3.86TEE42 pKa = 4.99SDD44 pKa = 3.14HH45 pKa = 7.63DD46 pKa = 4.25EE47 pKa = 4.37NGTLRR52 pKa = 11.84LATFF56 pKa = 4.48
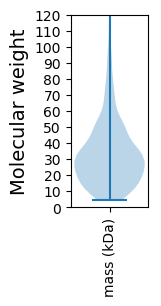
Molecular weight: 6.5 kDa
Isoelectric point according different methods:
Protein with the highest isoelectric point:
>tr|A0A2Z6T855|A0A2Z6T855_9LACO Pyruvate kinase OS=Lactobacillus rodentium OX=947835 GN=pykF PE=3 SV=1
MM1 pKa = 6.05TTKK4 pKa = 9.88RR5 pKa = 11.84TYY7 pKa = 9.64QPKK10 pKa = 8.89KK11 pKa = 7.38RR12 pKa = 11.84HH13 pKa = 5.81RR14 pKa = 11.84SRR16 pKa = 11.84VHH18 pKa = 6.84GFMKK22 pKa = 10.51RR23 pKa = 11.84MATSNGRR30 pKa = 11.84KK31 pKa = 8.81VLARR35 pKa = 11.84RR36 pKa = 11.84RR37 pKa = 11.84KK38 pKa = 9.2KK39 pKa = 10.05GRR41 pKa = 11.84KK42 pKa = 8.66VLSAA46 pKa = 4.05
MM1 pKa = 6.05TTKK4 pKa = 9.88RR5 pKa = 11.84TYY7 pKa = 9.64QPKK10 pKa = 8.89KK11 pKa = 7.38RR12 pKa = 11.84HH13 pKa = 5.81RR14 pKa = 11.84SRR16 pKa = 11.84VHH18 pKa = 6.84GFMKK22 pKa = 10.51RR23 pKa = 11.84MATSNGRR30 pKa = 11.84KK31 pKa = 8.81VLARR35 pKa = 11.84RR36 pKa = 11.84RR37 pKa = 11.84KK38 pKa = 9.2KK39 pKa = 10.05GRR41 pKa = 11.84KK42 pKa = 8.66VLSAA46 pKa = 4.05
Molecular weight: 5.5 kDa
Isoelectric point according different methods:
Peptides (in silico digests for buttom-up proteomics)
Below you can find in silico digests of the whole proteome with Trypsin, Chymotrypsin, Trypsin+LysC, LysN, ArgC proteases suitable for different mass spec machines.| Try ESI |
 |
|---|
| ChTry ESI |
|
|---|
| ArgC ESI |
|
|---|
| LysN ESI |
|
|---|
| TryLysC ESI |
|
|---|
| Try MALDI |
|
|---|
| ChTry MALDI |
|
|---|
| ArgC MALDI |
|
|---|
| LysN MALDI |
|
|---|
| TryLysC MALDI |
|
|---|
| Try LTQ |
|
|---|
| ChTry LTQ |
|
|---|
| ArgC LTQ |
|
|---|
| LysN LTQ |
|
|---|
| TryLysC LTQ |
|
|---|
| Try MSlow |
|
|---|
| ChTry MSlow |
|
|---|
| ArgC MSlow |
|
|---|
| LysN MSlow |
|
|---|
| TryLysC MSlow |
|
|---|
| Try MShigh |
|
|---|
| ChTry MShigh |
|
|---|
| ArgC MShigh |
|
|---|
| LysN MShigh |
|
|---|
| TryLysC MShigh |
|
|---|
General Statistics
Number of major isoforms |
Number of additional isoforms |
Number of all proteins |
Number of amino acids |
Min. Seq. Length |
Max. Seq. Length |
Avg. Seq. Length |
Avg. Mol. Weight |
|---|---|---|---|---|---|---|---|
0 |
450018 |
39 |
3245 |
313.8 |
35.16 |
Amino acid frequency
Ala |
Cys |
Asp |
Glu |
Phe |
Gly |
His |
Ile |
Lys |
Leu |
|---|---|---|---|---|---|---|---|---|---|
7.341 ± 0.131 | 0.446 ± 0.014 |
5.896 ± 0.071 | 5.966 ± 0.069 |
4.278 ± 0.064 | 6.401 ± 0.058 |
1.983 ± 0.033 | 7.648 ± 0.077 |
7.89 ± 0.067 | 9.367 ± 0.113 |
Met |
Asn |
Gln |
Pro |
Arg |
Ser |
Thr |
Val |
Trp |
Tyr |
|---|---|---|---|---|---|---|---|---|---|
2.445 ± 0.036 | 5.768 ± 0.064 |
3.661 ± 0.05 | 4.105 ± 0.051 |
3.526 ± 0.055 | 6.015 ± 0.121 |
5.852 ± 0.089 | 6.62 ± 0.055 |
1.012 ± 0.025 | 3.727 ± 0.045 |
Most of the basic statistics you can see at this page can be downloaded from this CSV file
See this proteome in:

Proteome-pI is available under Creative Commons Attribution-NoDerivs license, for more details see here
| Reference: Kozlowski LP. Proteome-pI 2.0: Proteome Isoelectric Point Database Update. Nucleic Acids Res. 2021, doi: 10.1093/nar/gkab944 | Contact: Lukasz P. Kozlowski |