Falsibacillus pallidus
Taxonomy: cellular organisms; Bacteria; Terrabacteria group; Firmicutes; Bacilli; Bacillales; Bacillaceae; Falsibacillus
Average proteome isoelectric point is 6.37
Get precalculated fractions of proteins
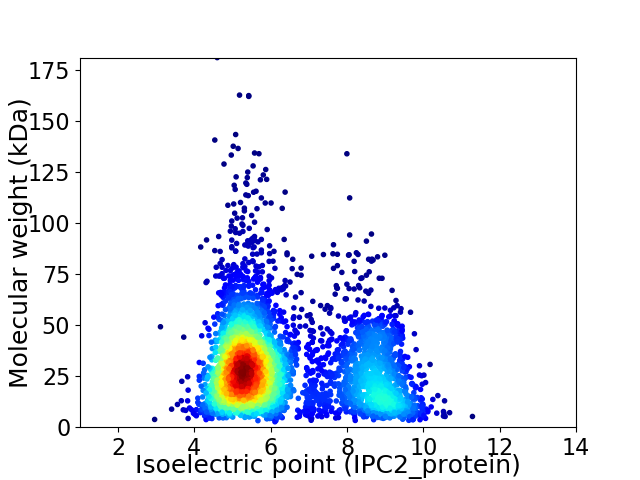
Virtual 2D-PAGE plot for 3956 proteins (isoelectric point calculated using IPC2_protein)
Get csv file with sequences according to given criteria:
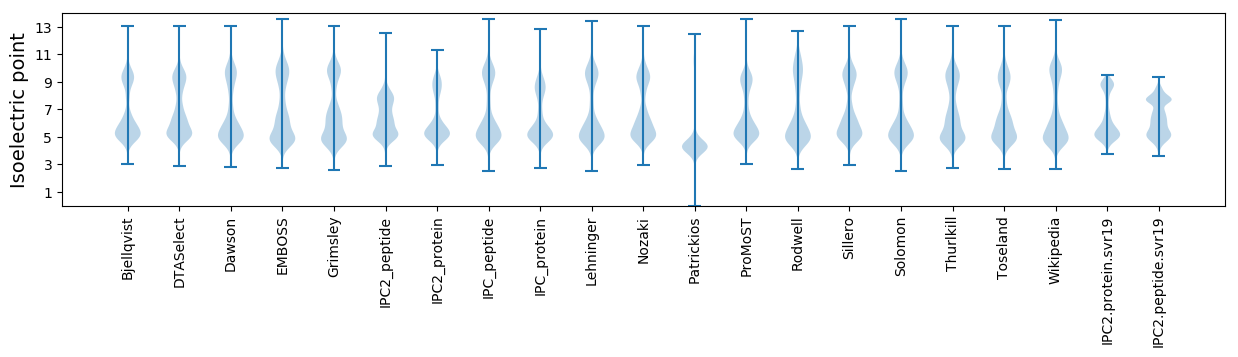
* You can choose from 21 different methods for calculating isoelectric point
Summary statistics related to proteome-wise predictions
Protein with the lowest isoelectric point:
>tr|A0A370GHB1|A0A370GHB1_9BACI RNase_H_2 domain-containing protein OS=Falsibacillus pallidus OX=493781 GN=DFR59_10487 PE=4 SV=1
MM1 pKa = 6.43QTVINIFSIKK11 pKa = 10.01VNSVSNNGSINIGEE25 pKa = 4.53ALHH28 pKa = 6.41NSPTANQKK36 pKa = 9.87SQGQTTAYY44 pKa = 10.15GDD46 pKa = 3.73YY47 pKa = 10.31AAPASAMEE55 pKa = 4.46NVYY58 pKa = 10.23IDD60 pKa = 4.77PDD62 pKa = 4.03LNDD65 pKa = 3.88QGDD68 pKa = 3.71IMDD71 pKa = 4.21NTPVISNQMM80 pKa = 3.3
MM1 pKa = 6.43QTVINIFSIKK11 pKa = 10.01VNSVSNNGSINIGEE25 pKa = 4.53ALHH28 pKa = 6.41NSPTANQKK36 pKa = 9.87SQGQTTAYY44 pKa = 10.15GDD46 pKa = 3.73YY47 pKa = 10.31AAPASAMEE55 pKa = 4.46NVYY58 pKa = 10.23IDD60 pKa = 4.77PDD62 pKa = 4.03LNDD65 pKa = 3.88QGDD68 pKa = 3.71IMDD71 pKa = 4.21NTPVISNQMM80 pKa = 3.3
Molecular weight: 8.55 kDa
Isoelectric point according different methods:
Protein with the highest isoelectric point:
>tr|A0A370GBE4|A0A370GBE4_9BACI 3-oxoacyl-[acyl-carrier protein] reductase OS=Falsibacillus pallidus OX=493781 GN=DFR59_11092 PE=4 SV=1
MM1 pKa = 7.44KK2 pKa = 9.59RR3 pKa = 11.84TFQPNKK9 pKa = 8.24RR10 pKa = 11.84KK11 pKa = 9.6RR12 pKa = 11.84SKK14 pKa = 9.83VHH16 pKa = 5.77GFRR19 pKa = 11.84ARR21 pKa = 11.84MSTKK25 pKa = 9.66NGRR28 pKa = 11.84RR29 pKa = 11.84VLAARR34 pKa = 11.84RR35 pKa = 11.84RR36 pKa = 11.84RR37 pKa = 11.84GRR39 pKa = 11.84KK40 pKa = 8.99VLSAA44 pKa = 4.11
MM1 pKa = 7.44KK2 pKa = 9.59RR3 pKa = 11.84TFQPNKK9 pKa = 8.24RR10 pKa = 11.84KK11 pKa = 9.6RR12 pKa = 11.84SKK14 pKa = 9.83VHH16 pKa = 5.77GFRR19 pKa = 11.84ARR21 pKa = 11.84MSTKK25 pKa = 9.66NGRR28 pKa = 11.84RR29 pKa = 11.84VLAARR34 pKa = 11.84RR35 pKa = 11.84RR36 pKa = 11.84RR37 pKa = 11.84GRR39 pKa = 11.84KK40 pKa = 8.99VLSAA44 pKa = 4.11
Molecular weight: 5.25 kDa
Isoelectric point according different methods:
Peptides (in silico digests for buttom-up proteomics)
Below you can find in silico digests of the whole proteome with Trypsin, Chymotrypsin, Trypsin+LysC, LysN, ArgC proteases suitable for different mass spec machines.| Try ESI |
 |
|---|
| ChTry ESI |
|
|---|
| ArgC ESI |
|
|---|
| LysN ESI |
|
|---|
| TryLysC ESI |
|
|---|
| Try MALDI |
|
|---|
| ChTry MALDI |
|
|---|
| ArgC MALDI |
|
|---|
| LysN MALDI |
|
|---|
| TryLysC MALDI |
|
|---|
| Try LTQ |
|
|---|
| ChTry LTQ |
|
|---|
| ArgC LTQ |
|
|---|
| LysN LTQ |
|
|---|
| TryLysC LTQ |
|
|---|
| Try MSlow |
|
|---|
| ChTry MSlow |
|
|---|
| ArgC MSlow |
|
|---|
| LysN MSlow |
|
|---|
| TryLysC MSlow |
|
|---|
| Try MShigh |
|
|---|
| ChTry MShigh |
|
|---|
| ArgC MShigh |
|
|---|
| LysN MShigh |
|
|---|
| TryLysC MShigh |
|
|---|
General Statistics
Number of major isoforms |
Number of additional isoforms |
Number of all proteins |
Number of amino acids |
Min. Seq. Length |
Max. Seq. Length |
Avg. Seq. Length |
Avg. Mol. Weight |
|---|---|---|---|---|---|---|---|
0 |
1115423 |
25 |
1674 |
282.0 |
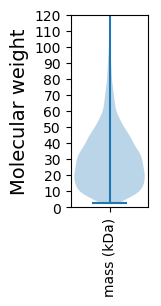
31.66 |
Amino acid frequency
Ala |
Cys |
Asp |
Glu |
Phe |
Gly |
His |
Ile |
Lys |
Leu |
|---|---|---|---|---|---|---|---|---|---|
7.077 ± 0.041 | 0.725 ± 0.013 |
5.172 ± 0.029 | 7.53 ± 0.052 |
4.702 ± 0.035 | 7.029 ± 0.037 |
2.123 ± 0.02 | 7.776 ± 0.036 |
7.323 ± 0.035 | 9.721 ± 0.043 |
Met |
Asn |
Gln |
Pro |
Arg |
Ser |
Thr |
Val |
Trp |
Tyr |
|---|---|---|---|---|---|---|---|---|---|
2.983 ± 0.02 | 4.261 ± 0.027 |
3.684 ± 0.028 | 3.554 ± 0.026 |
3.941 ± 0.028 | 6.294 ± 0.032 |
4.968 ± 0.026 | 6.637 ± 0.035 |
1.063 ± 0.016 | 3.437 ± 0.025 |
Most of the basic statistics you can see at this page can be downloaded from this CSV file
See this proteome in:

Proteome-pI is available under Creative Commons Attribution-NoDerivs license, for more details see here
| Reference: Kozlowski LP. Proteome-pI 2.0: Proteome Isoelectric Point Database Update. Nucleic Acids Res. 2021, doi: 10.1093/nar/gkab944 | Contact: Lukasz P. Kozlowski |