Escherichia phage ECBP1
Taxonomy: Viruses; Duplodnaviria; Heunggongvirae; Uroviricota; Caudoviricetes; Caudovirales; Schitoviridae; Enquatrovirinae; Gamaleyavirus; Escherichia virus ECBP1
Average proteome isoelectric point is 6.26
Get precalculated fractions of proteins
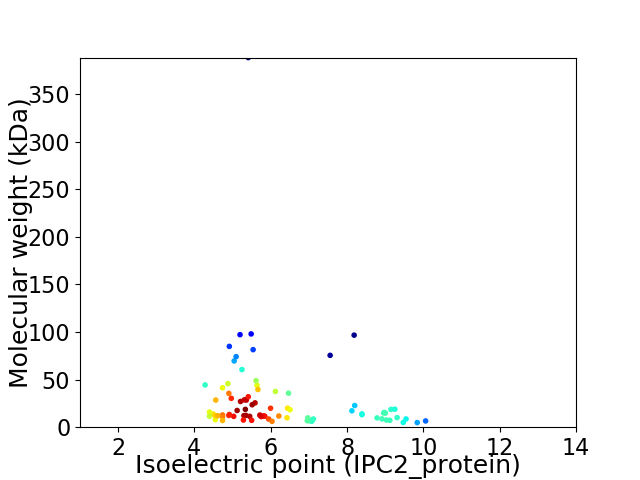
Virtual 2D-PAGE plot for 82 proteins (isoelectric point calculated using IPC2_protein)
Get csv file with sequences according to given criteria:
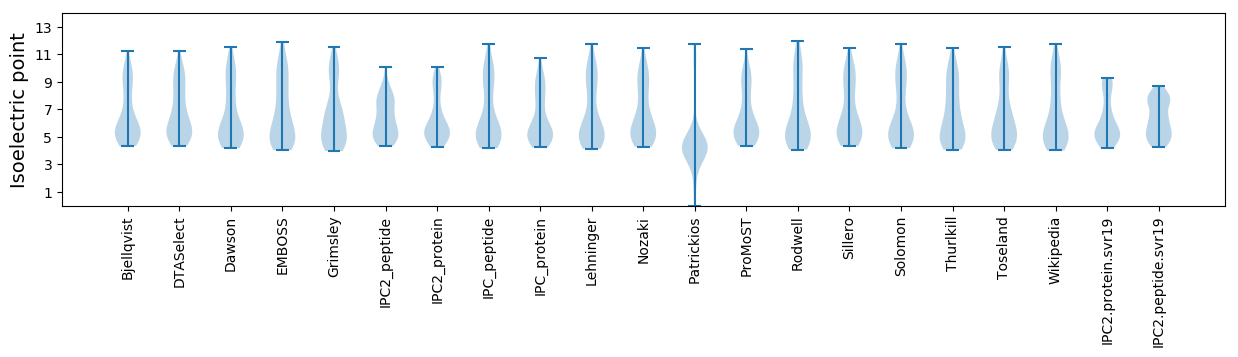
* You can choose from 21 different methods for calculating isoelectric point
Summary statistics related to proteome-wise predictions
Protein with the lowest isoelectric point:
>tr|J9RVQ5|J9RVQ5_9CAUD Uncharacterized protein OS=Escherichia phage ECBP1 OX=1604356 GN=ECBP1_0061 PE=4 SV=1
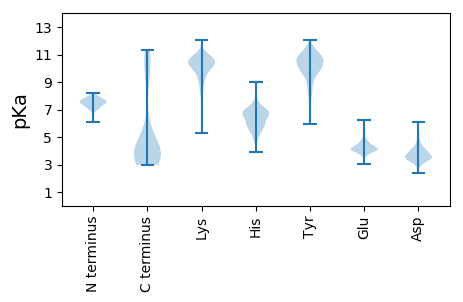
MM1 pKa = 7.14ATVSKK6 pKa = 10.28EE7 pKa = 3.9AIEE10 pKa = 4.5AKK12 pKa = 9.96IKK14 pKa = 10.23SVYY17 pKa = 9.63YY18 pKa = 10.27FNGADD23 pKa = 3.32AVKK26 pKa = 10.42SAFVDD31 pKa = 5.21PSALPADD38 pKa = 4.27DD39 pKa = 4.65LANLGLVTYY48 pKa = 9.26CVIILEE54 pKa = 4.37NNFKK58 pKa = 11.02VEE60 pKa = 4.2GVSACVDD67 pKa = 3.14PTIYY71 pKa = 10.55DD72 pKa = 3.69EE73 pKa = 4.34QLGRR77 pKa = 11.84QYY79 pKa = 11.46AYY81 pKa = 10.1EE82 pKa = 3.92NAFNKK87 pKa = 9.47IWEE90 pKa = 4.31LEE92 pKa = 4.3GYY94 pKa = 10.14LLRR97 pKa = 11.84QALHH101 pKa = 6.28EE102 pKa = 4.37KK103 pKa = 10.79EE104 pKa = 4.16EE105 pKa = 4.19TAKK108 pKa = 11.03ALASFAEE115 pKa = 4.27NNTCDD120 pKa = 4.75GGGCTII126 pKa = 4.85
MM1 pKa = 7.14ATVSKK6 pKa = 10.28EE7 pKa = 3.9AIEE10 pKa = 4.5AKK12 pKa = 9.96IKK14 pKa = 10.23SVYY17 pKa = 9.63YY18 pKa = 10.27FNGADD23 pKa = 3.32AVKK26 pKa = 10.42SAFVDD31 pKa = 5.21PSALPADD38 pKa = 4.27DD39 pKa = 4.65LANLGLVTYY48 pKa = 9.26CVIILEE54 pKa = 4.37NNFKK58 pKa = 11.02VEE60 pKa = 4.2GVSACVDD67 pKa = 3.14PTIYY71 pKa = 10.55DD72 pKa = 3.69EE73 pKa = 4.34QLGRR77 pKa = 11.84QYY79 pKa = 11.46AYY81 pKa = 10.1EE82 pKa = 3.92NAFNKK87 pKa = 9.47IWEE90 pKa = 4.31LEE92 pKa = 4.3GYY94 pKa = 10.14LLRR97 pKa = 11.84QALHH101 pKa = 6.28EE102 pKa = 4.37KK103 pKa = 10.79EE104 pKa = 4.16EE105 pKa = 4.19TAKK108 pKa = 11.03ALASFAEE115 pKa = 4.27NNTCDD120 pKa = 4.75GGGCTII126 pKa = 4.85
Molecular weight: 13.77 kDa
Isoelectric point according different methods:
Protein with the highest isoelectric point:
>tr|J9RVR7|J9RVR7_9CAUD Uncharacterized protein OS=Escherichia phage ECBP1 OX=1604356 GN=ECBP1_0077 PE=4 SV=1
MM1 pKa = 7.61VDD3 pKa = 4.65GIQLGMFNISGQVITLTAVSVRR25 pKa = 11.84VMQTVTLYY33 pKa = 10.71KK34 pKa = 10.17KK35 pKa = 10.3RR36 pKa = 11.84PKK38 pKa = 10.47LGLSFNN44 pKa = 4.21
MM1 pKa = 7.61VDD3 pKa = 4.65GIQLGMFNISGQVITLTAVSVRR25 pKa = 11.84VMQTVTLYY33 pKa = 10.71KK34 pKa = 10.17KK35 pKa = 10.3RR36 pKa = 11.84PKK38 pKa = 10.47LGLSFNN44 pKa = 4.21
Molecular weight: 4.86 kDa
Isoelectric point according different methods:
Peptides (in silico digests for buttom-up proteomics)
Below you can find in silico digests of the whole proteome with Trypsin, Chymotrypsin, Trypsin+LysC, LysN, ArgC proteases suitable for different mass spec machines.| Try ESI |
 |
|---|
| ChTry ESI |
|
|---|
| ArgC ESI |
|
|---|
| LysN ESI |
|
|---|
| TryLysC ESI |
|
|---|
| Try MALDI |
|
|---|
| ChTry MALDI |
|
|---|
| ArgC MALDI |
|
|---|
| LysN MALDI |
|
|---|
| TryLysC MALDI |
|
|---|
| Try LTQ |
|
|---|
| ChTry LTQ |
|
|---|
| ArgC LTQ |
|
|---|
| LysN LTQ |
|
|---|
| TryLysC LTQ |
|
|---|
| Try MSlow |
|
|---|
| ChTry MSlow |
|
|---|
| ArgC MSlow |
|
|---|
| LysN MSlow |
|
|---|
| TryLysC MSlow |
|
|---|
| Try MShigh |
|
|---|
| ChTry MShigh |
|
|---|
| ArgC MShigh |
|
|---|
| LysN MShigh |
|
|---|
| TryLysC MShigh |
|
|---|
General Statistics
Number of major isoforms |
Number of additional isoforms |
Number of all proteins |
Number of amino acids |
Min. Seq. Length |
Max. Seq. Length |
Avg. Seq. Length |
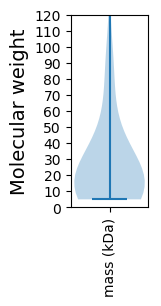
Avg. Mol. Weight |
|---|---|---|---|---|---|---|---|
0 |
21275 |
42 |
3570 |
259.5 |
28.89 |
Amino acid frequency
Ala |
Cys |
Asp |
Glu |
Phe |
Gly |
His |
Ile |
Lys |
Leu |
|---|---|---|---|---|---|---|---|---|---|
8.597 ± 0.6 | 0.846 ± 0.158 |
5.734 ± 0.164 | 6.599 ± 0.266 |
3.638 ± 0.183 | 6.618 ± 0.255 |
1.758 ± 0.16 | 5.716 ± 0.234 |
6.599 ± 0.308 | 8.315 ± 0.219 |
Met |
Asn |
Gln |
Pro |
Arg |
Ser |
Thr |
Val |
Trp |
Tyr |
|---|---|---|---|---|---|---|---|---|---|
2.957 ± 0.118 | 5.763 ± 0.148 |
4.169 ± 0.151 | 4.188 ± 0.277 |
4.235 ± 0.186 | 6.12 ± 0.234 |
6.454 ± 0.298 | 6.867 ± 0.248 |
1.142 ± 0.103 | 3.685 ± 0.253 |
Most of the basic statistics you can see at this page can be downloaded from this CSV file
See this proteome in:

Proteome-pI is available under Creative Commons Attribution-NoDerivs license, for more details see here
| Reference: Kozlowski LP. Proteome-pI 2.0: Proteome Isoelectric Point Database Update. Nucleic Acids Res. 2021, doi: 10.1093/nar/gkab944 | Contact: Lukasz P. Kozlowski |