Candidatus Acidianus copahuensis
Taxonomy: cellular organisms; Archaea; TACK group; Crenarchaeota; Thermoprotei; Sulfolobales; Sulfolobaceae; Acidianus
Average proteome isoelectric point is 6.88
Get precalculated fractions of proteins
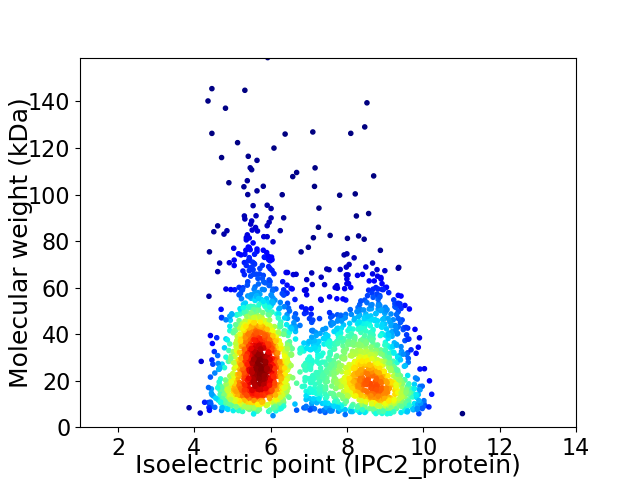
Virtual 2D-PAGE plot for 2328 proteins (isoelectric point calculated using IPC2_protein)
Get csv file with sequences according to given criteria:
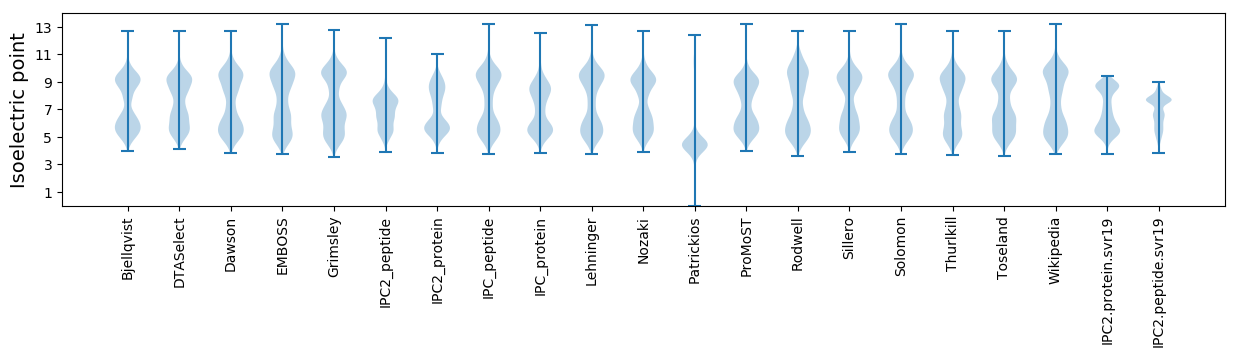
* You can choose from 21 different methods for calculating isoelectric point
Summary statistics related to proteome-wise predictions
Protein with the lowest isoelectric point:
>tr|A0A031LUH0|A0A031LUH0_9CREN HTH_34 domain-containing protein OS=Candidatus Acidianus copahuensis OX=1160895 GN=CM19_00175 PE=4 SV=1
MM1 pKa = 7.37YY2 pKa = 10.39SLSNVSSSADD12 pKa = 3.27LDD14 pKa = 3.75YY15 pKa = 11.68SMNMSSNFYY24 pKa = 9.55QVEE27 pKa = 3.58IRR29 pKa = 11.84EE30 pKa = 4.19FDD32 pKa = 3.62DD33 pKa = 4.0GVYY36 pKa = 10.23ISFGGEE42 pKa = 3.62PFNAEE47 pKa = 3.69SHH49 pKa = 6.67DD50 pKa = 3.98ANVQIWRR57 pKa = 11.84DD58 pKa = 2.94KK59 pKa = 10.81DD60 pKa = 3.43GRR62 pKa = 11.84IVAIDD67 pKa = 3.49IFYY70 pKa = 10.71DD71 pKa = 3.85EE72 pKa = 4.65PP73 pKa = 5.47
MM1 pKa = 7.37YY2 pKa = 10.39SLSNVSSSADD12 pKa = 3.27LDD14 pKa = 3.75YY15 pKa = 11.68SMNMSSNFYY24 pKa = 9.55QVEE27 pKa = 3.58IRR29 pKa = 11.84EE30 pKa = 4.19FDD32 pKa = 3.62DD33 pKa = 4.0GVYY36 pKa = 10.23ISFGGEE42 pKa = 3.62PFNAEE47 pKa = 3.69SHH49 pKa = 6.67DD50 pKa = 3.98ANVQIWRR57 pKa = 11.84DD58 pKa = 2.94KK59 pKa = 10.81DD60 pKa = 3.43GRR62 pKa = 11.84IVAIDD67 pKa = 3.49IFYY70 pKa = 10.71DD71 pKa = 3.85EE72 pKa = 4.65PP73 pKa = 5.47
Molecular weight: 8.37 kDa
Isoelectric point according different methods:
Protein with the highest isoelectric point:
>tr|A0A031LMP9|A0A031LMP9_9CREN GTPase OS=Candidatus Acidianus copahuensis OX=1160895 GN=CM19_08240 PE=3 SV=1
MM1 pKa = 7.38SRR3 pKa = 11.84NKK5 pKa = 10.24PSGKK9 pKa = 9.93KK10 pKa = 9.72NRR12 pKa = 11.84LGKK15 pKa = 10.56AMNSNKK21 pKa = 10.21AIPAWVILRR30 pKa = 11.84TGAKK34 pKa = 10.08LKK36 pKa = 9.8TNPLKK41 pKa = 10.96RR42 pKa = 11.84NWRR45 pKa = 11.84RR46 pKa = 11.84SKK48 pKa = 11.12LKK50 pKa = 10.42VV51 pKa = 3.04
MM1 pKa = 7.38SRR3 pKa = 11.84NKK5 pKa = 10.24PSGKK9 pKa = 9.93KK10 pKa = 9.72NRR12 pKa = 11.84LGKK15 pKa = 10.56AMNSNKK21 pKa = 10.21AIPAWVILRR30 pKa = 11.84TGAKK34 pKa = 10.08LKK36 pKa = 9.8TNPLKK41 pKa = 10.96RR42 pKa = 11.84NWRR45 pKa = 11.84RR46 pKa = 11.84SKK48 pKa = 11.12LKK50 pKa = 10.42VV51 pKa = 3.04
Molecular weight: 5.84 kDa
Isoelectric point according different methods:
Peptides (in silico digests for buttom-up proteomics)
Below you can find in silico digests of the whole proteome with Trypsin, Chymotrypsin, Trypsin+LysC, LysN, ArgC proteases suitable for different mass spec machines.| Try ESI |
 |
|---|
| ChTry ESI |
|
|---|
| ArgC ESI |
|
|---|
| LysN ESI |
|
|---|
| TryLysC ESI |
|
|---|
| Try MALDI |
|
|---|
| ChTry MALDI |
|
|---|
| ArgC MALDI |
|
|---|
| LysN MALDI |
|
|---|
| TryLysC MALDI |
|
|---|
| Try LTQ |
|
|---|
| ChTry LTQ |
|
|---|
| ArgC LTQ |
|
|---|
| LysN LTQ |
|
|---|
| TryLysC LTQ |
|
|---|
| Try MSlow |
|
|---|
| ChTry MSlow |
|
|---|
| ArgC MSlow |
|
|---|
| LysN MSlow |
|
|---|
| TryLysC MSlow |
|
|---|
| Try MShigh |
|
|---|
| ChTry MShigh |
|
|---|
| ArgC MShigh |
|
|---|
| LysN MShigh |
|
|---|
| TryLysC MShigh |
|
|---|
General Statistics
Number of major isoforms |
Number of additional isoforms |
Number of all proteins |
Number of amino acids |
Min. Seq. Length |
Max. Seq. Length |
Avg. Seq. Length |
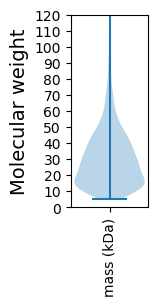
Avg. Mol. Weight |
|---|---|---|---|---|---|---|---|
0 |
650260 |
41 |
1434 |
279.3 |
31.41 |
Amino acid frequency
Ala |
Cys |
Asp |
Glu |
Phe |
Gly |
His |
Ile |
Lys |
Leu |
|---|---|---|---|---|---|---|---|---|---|
5.694 ± 0.049 | 0.636 ± 0.016 |
4.881 ± 0.045 | 6.904 ± 0.059 |
4.584 ± 0.046 | 7.029 ± 0.049 |
1.271 ± 0.016 | 9.405 ± 0.059 |
7.56 ± 0.06 | 9.824 ± 0.067 |
Met |
Asn |
Gln |
Pro |
Arg |
Ser |
Thr |
Val |
Trp |
Tyr |
|---|---|---|---|---|---|---|---|---|---|
2.428 ± 0.026 | 4.497 ± 0.038 |
3.984 ± 0.034 | 2.109 ± 0.027 |
4.415 ± 0.047 | 7.371 ± 0.051 |
4.743 ± 0.042 | 7.341 ± 0.043 |
1.036 ± 0.02 | 4.288 ± 0.037 |
Most of the basic statistics you can see at this page can be downloaded from this CSV file
See this proteome in:

Proteome-pI is available under Creative Commons Attribution-NoDerivs license, for more details see here
| Reference: Kozlowski LP. Proteome-pI 2.0: Proteome Isoelectric Point Database Update. Nucleic Acids Res. 2021, doi: 10.1093/nar/gkab944 | Contact: Lukasz P. Kozlowski |