Mycobacterium haemophilum
Taxonomy: cellular organisms; Bacteria;
Average proteome isoelectric point is 6.32
Get precalculated fractions of proteins
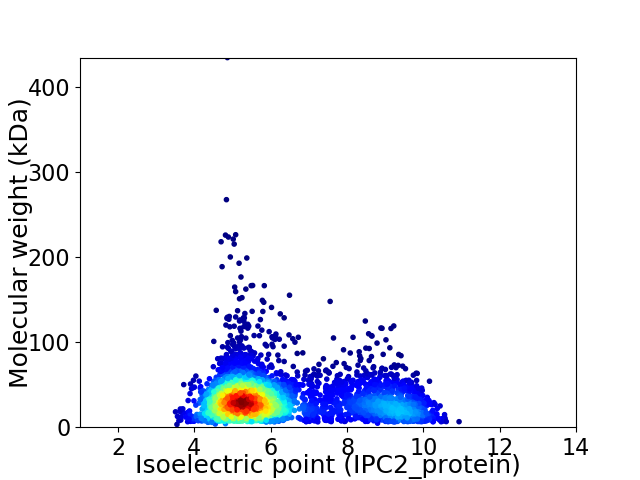
Virtual 2D-PAGE plot for 3743 proteins (isoelectric point calculated using IPC2_protein)
Get csv file with sequences according to given criteria:
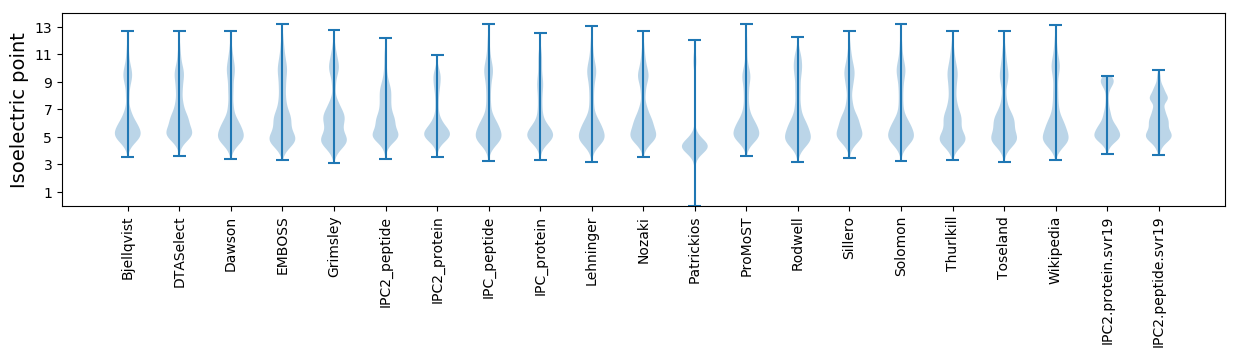
* You can choose from 21 different methods for calculating isoelectric point
Summary statistics related to proteome-wise predictions
Protein with the lowest isoelectric point:
>tr|A0A0I9TV89|A0A0I9TV89_9MYCO Esterase OS=Mycobacterium haemophilum OX=29311 GN=ABH38_02245 PE=4 SV=1
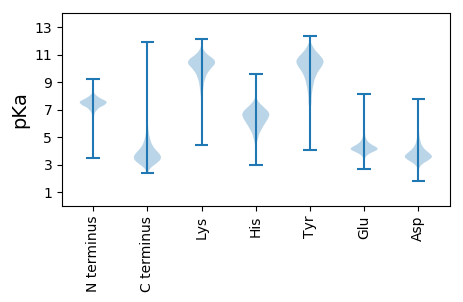
MM1 pKa = 7.78SDD3 pKa = 3.21YY4 pKa = 11.53KK5 pKa = 10.95LFRR8 pKa = 11.84CVQCGFEE15 pKa = 3.99YY16 pKa = 10.91DD17 pKa = 3.98EE18 pKa = 4.57AQGWPEE24 pKa = 4.38DD25 pKa = 4.2GIEE28 pKa = 4.69PGTRR32 pKa = 11.84WDD34 pKa = 5.75DD35 pKa = 3.57IPEE38 pKa = 4.28DD39 pKa = 4.18WSCPDD44 pKa = 3.79CGAAKK49 pKa = 10.43ADD51 pKa = 3.7FEE53 pKa = 4.55MVEE56 pKa = 4.25VARR59 pKa = 11.84PP60 pKa = 3.22
MM1 pKa = 7.78SDD3 pKa = 3.21YY4 pKa = 11.53KK5 pKa = 10.95LFRR8 pKa = 11.84CVQCGFEE15 pKa = 3.99YY16 pKa = 10.91DD17 pKa = 3.98EE18 pKa = 4.57AQGWPEE24 pKa = 4.38DD25 pKa = 4.2GIEE28 pKa = 4.69PGTRR32 pKa = 11.84WDD34 pKa = 5.75DD35 pKa = 3.57IPEE38 pKa = 4.28DD39 pKa = 4.18WSCPDD44 pKa = 3.79CGAAKK49 pKa = 10.43ADD51 pKa = 3.7FEE53 pKa = 4.55MVEE56 pKa = 4.25VARR59 pKa = 11.84PP60 pKa = 3.22
Molecular weight: 6.86 kDa
Isoelectric point according different methods:
Protein with the highest isoelectric point:
>tr|A0A0I9UPP1|A0A0I9UPP1_9MYCO UPF0678 fatty acid-binding protein-like protein ABH38_03365 OS=Mycobacterium haemophilum OX=29311 GN=ABH38_03365 PE=3 SV=1
MM1 pKa = 7.89RR2 pKa = 11.84GFSQNTNRR10 pKa = 11.84PRR12 pKa = 11.84AIHH15 pKa = 6.53ARR17 pKa = 11.84TISWWVSSAVATTTASTSALFTQSRR42 pKa = 11.84GSWKK46 pKa = 8.39TAAVGTAAAARR57 pKa = 11.84SANGII62 pKa = 3.85
MM1 pKa = 7.89RR2 pKa = 11.84GFSQNTNRR10 pKa = 11.84PRR12 pKa = 11.84AIHH15 pKa = 6.53ARR17 pKa = 11.84TISWWVSSAVATTTASTSALFTQSRR42 pKa = 11.84GSWKK46 pKa = 8.39TAAVGTAAAARR57 pKa = 11.84SANGII62 pKa = 3.85
Molecular weight: 6.5 kDa
Isoelectric point according different methods:
Peptides (in silico digests for buttom-up proteomics)
Below you can find in silico digests of the whole proteome with Trypsin, Chymotrypsin, Trypsin+LysC, LysN, ArgC proteases suitable for different mass spec machines.| Try ESI |
 |
|---|
| ChTry ESI |
|
|---|
| ArgC ESI |
|
|---|
| LysN ESI |
|
|---|
| TryLysC ESI |
|
|---|
| Try MALDI |
|
|---|
| ChTry MALDI |
|
|---|
| ArgC MALDI |
|
|---|
| LysN MALDI |
|
|---|
| TryLysC MALDI |
|
|---|
| Try LTQ |
|
|---|
| ChTry LTQ |
|
|---|
| ArgC LTQ |
|
|---|
| LysN LTQ |
|
|---|
| TryLysC LTQ |
|
|---|
| Try MSlow |
|
|---|
| ChTry MSlow |
|
|---|
| ArgC MSlow |
|
|---|
| LysN MSlow |
|
|---|
| TryLysC MSlow |
|
|---|
| Try MShigh |
|
|---|
| ChTry MShigh |
|
|---|
| ArgC MShigh |
|
|---|
| LysN MShigh |
|
|---|
| TryLysC MShigh |
|
|---|
General Statistics
Number of major isoforms |
Number of additional isoforms |
Number of all proteins |
Number of amino acids |
Min. Seq. Length |
Max. Seq. Length |
Avg. Seq. Length |
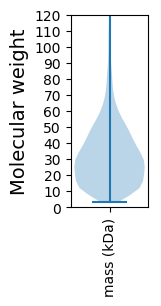
Avg. Mol. Weight |
|---|---|---|---|---|---|---|---|
0 |
1208662 |
29 |
4163 |
322.9 |
34.66 |
Amino acid frequency
Ala |
Cys |
Asp |
Glu |
Phe |
Gly |
His |
Ile |
Lys |
Leu |
|---|---|---|---|---|---|---|---|---|---|
13.097 ± 0.053 | 0.873 ± 0.011 |
5.994 ± 0.036 | 4.9 ± 0.035 |
2.922 ± 0.023 | 8.744 ± 0.051 |
2.282 ± 0.016 | 4.405 ± 0.027 |
2.204 ± 0.029 | 9.989 ± 0.042 |
Met |
Asn |
Gln |
Pro |
Arg |
Ser |
Thr |
Val |
Trp |
Tyr |
|---|---|---|---|---|---|---|---|---|---|
2.064 ± 0.016 | 2.352 ± 0.021 |
5.73 ± 0.03 | 3.264 ± 0.022 |
7.244 ± 0.048 | 5.601 ± 0.026 |
6.011 ± 0.026 | 8.675 ± 0.035 |
1.495 ± 0.017 | 2.152 ± 0.02 |
Most of the basic statistics you can see at this page can be downloaded from this CSV file
See this proteome in:

Proteome-pI is available under Creative Commons Attribution-NoDerivs license, for more details see here
| Reference: Kozlowski LP. Proteome-pI 2.0: Proteome Isoelectric Point Database Update. Nucleic Acids Res. 2021, doi: 10.1093/nar/gkab944 | Contact: Lukasz P. Kozlowski |