Vibrio phage ND1-fs1
Taxonomy: Viruses; Monodnaviria; Loebvirae; Hofneiviricota; Faserviricetes; Tubulavirales; Inoviridae; Fibrovirus; unclassified Fibrovirus
Average proteome isoelectric point is 6.84
Get precalculated fractions of proteins
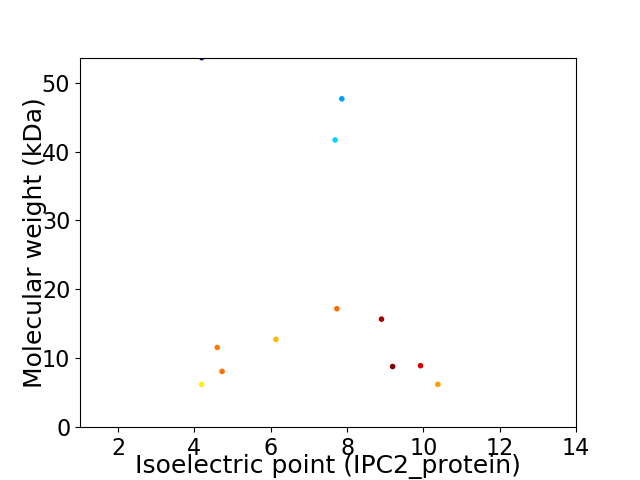
Virtual 2D-PAGE plot for 12 proteins (isoelectric point calculated using IPC2_protein)
Get csv file with sequences according to given criteria:
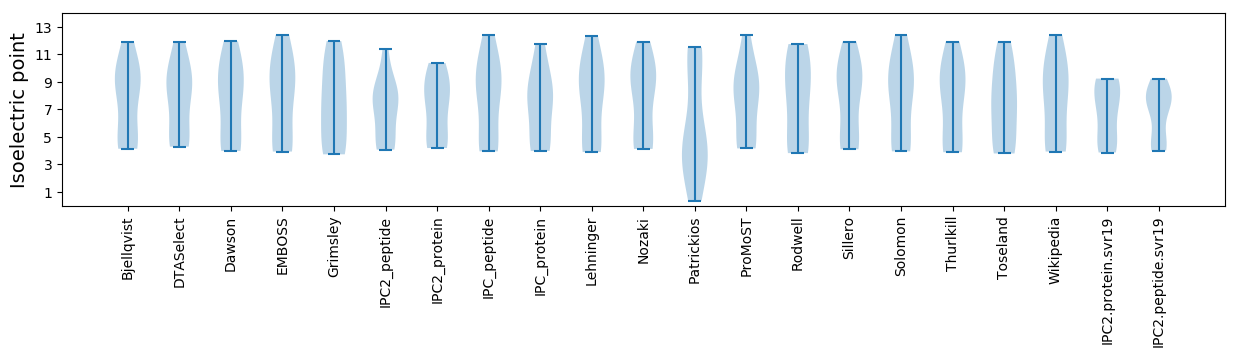
* You can choose from 21 different methods for calculating isoelectric point
Summary statistics related to proteome-wise predictions
Protein with the lowest isoelectric point:
>tr|E1CJD2|E1CJD2_9VIRU DNA primase OS=Vibrio phage ND1-fs1 OX=867695 PE=4 SV=1
MM1 pKa = 6.37VTNGLTDD8 pKa = 3.62CDD10 pKa = 3.7RR11 pKa = 11.84VCFFAEE17 pKa = 4.36FAMITALTGWGDD29 pKa = 3.56HH30 pKa = 5.71QGEE33 pKa = 4.44EE34 pKa = 4.62LRR36 pKa = 11.84SSAQGGQITIYY47 pKa = 10.72GDD49 pKa = 3.33SSPNFWGLL57 pKa = 3.09
MM1 pKa = 6.37VTNGLTDD8 pKa = 3.62CDD10 pKa = 3.7RR11 pKa = 11.84VCFFAEE17 pKa = 4.36FAMITALTGWGDD29 pKa = 3.56HH30 pKa = 5.71QGEE33 pKa = 4.44EE34 pKa = 4.62LRR36 pKa = 11.84SSAQGGQITIYY47 pKa = 10.72GDD49 pKa = 3.33SSPNFWGLL57 pKa = 3.09
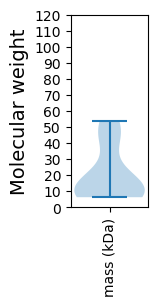
Molecular weight: 6.2 kDa
Isoelectric point according different methods:
Protein with the highest isoelectric point:
>tr|E1CJD3|E1CJD3_9VIRU Uncharacterized protein OS=Vibrio phage ND1-fs1 OX=867695 PE=4 SV=1
MM1 pKa = 7.51ANSAKK6 pKa = 10.25KK7 pKa = 8.22QTLSQSVNPFVTIQLTSGALPRR29 pKa = 11.84FLAYY33 pKa = 10.25GGFNSDD39 pKa = 2.52GSQRR43 pKa = 11.84FSVTSVSTDD52 pKa = 2.81AHH54 pKa = 6.7KK55 pKa = 10.72MPLPTANAILPKK67 pKa = 10.13IKK69 pKa = 10.48RR70 pKa = 11.84NWPLAQISYY79 pKa = 8.36QVKK82 pKa = 9.77
MM1 pKa = 7.51ANSAKK6 pKa = 10.25KK7 pKa = 8.22QTLSQSVNPFVTIQLTSGALPRR29 pKa = 11.84FLAYY33 pKa = 10.25GGFNSDD39 pKa = 2.52GSQRR43 pKa = 11.84FSVTSVSTDD52 pKa = 2.81AHH54 pKa = 6.7KK55 pKa = 10.72MPLPTANAILPKK67 pKa = 10.13IKK69 pKa = 10.48RR70 pKa = 11.84NWPLAQISYY79 pKa = 8.36QVKK82 pKa = 9.77
Molecular weight: 8.92 kDa
Isoelectric point according different methods:
Peptides (in silico digests for buttom-up proteomics)
Below you can find in silico digests of the whole proteome with Trypsin, Chymotrypsin, Trypsin+LysC, LysN, ArgC proteases suitable for different mass spec machines.| Try ESI |
 |
|---|
| ChTry ESI |
|
|---|
| ArgC ESI |
|
|---|
| LysN ESI |
|
|---|
| TryLysC ESI |
|
|---|
| Try MALDI |
|
|---|
| ChTry MALDI |
|
|---|
| ArgC MALDI |
|
|---|
| LysN MALDI |
|
|---|
| TryLysC MALDI |
|
|---|
| Try LTQ |
|
|---|
| ChTry LTQ |
|
|---|
| ArgC LTQ |
|
|---|
| LysN LTQ |
|
|---|
| TryLysC LTQ |
|
|---|
| Try MSlow |
|
|---|
| ChTry MSlow |
|
|---|
| ArgC MSlow |
|
|---|
| LysN MSlow |
|
|---|
| TryLysC MSlow |
|
|---|
| Try MShigh |
|
|---|
| ChTry MShigh |
|
|---|
| ArgC MShigh |
|
|---|
| LysN MShigh |
|
|---|
| TryLysC MShigh |
|
|---|
General Statistics
Number of major isoforms |
Number of additional isoforms |
Number of all proteins |
Number of amino acids |
Min. Seq. Length |
Max. Seq. Length |
Avg. Seq. Length |
Avg. Mol. Weight |
|---|---|---|---|---|---|---|---|
0 |
2117 |
52 |
493 |
176.4 |
19.87 |
Amino acid frequency
Ala |
Cys |
Asp |
Glu |
Phe |
Gly |
His |
Ile |
Lys |
Leu |
|---|---|---|---|---|---|---|---|---|---|
6.991 ± 0.706 | 1.889 ± 0.282 |
5.716 ± 0.709 | 5.102 ± 0.482 |
5.102 ± 0.203 | 6.094 ± 0.394 |
1.889 ± 0.546 | 7.463 ± 0.794 |
6.141 ± 0.592 | 8.219 ± 1.002 |
Met |
Asn |
Gln |
Pro |
Arg |
Ser |
Thr |
Val |
Trp |
Tyr |
|---|---|---|---|---|---|---|---|---|---|
2.929 ± 0.476 | 4.629 ± 0.653 |
5.432 ± 0.742 | 4.015 ± 0.343 |
4.487 ± 0.818 | 6.944 ± 0.93 |
5.527 ± 0.692 | 6.141 ± 0.402 |
1.417 ± 0.316 | 3.873 ± 0.588 |
Most of the basic statistics you can see at this page can be downloaded from this CSV file
See this proteome in:

Proteome-pI is available under Creative Commons Attribution-NoDerivs license, for more details see here
| Reference: Kozlowski LP. Proteome-pI 2.0: Proteome Isoelectric Point Database Update. Nucleic Acids Res. 2021, doi: 10.1093/nar/gkab944 | Contact: Lukasz P. Kozlowski |