Pseudoclavibacter caeni
Taxonomy: cellular organisms; Bacteria; Terrabacteria group; Actinobacteria; Actinomycetia; Micrococcales; Microbacteriaceae; Pseudoclavibacter
Average proteome isoelectric point is 6.34
Get precalculated fractions of proteins
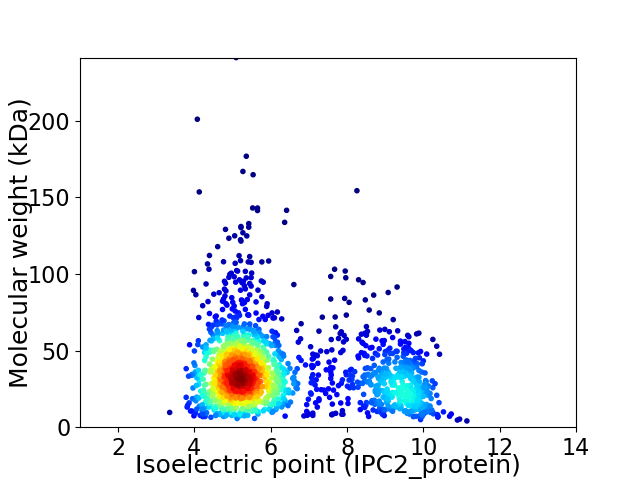
Virtual 2D-PAGE plot for 1700 proteins (isoelectric point calculated using IPC2_protein)
Get csv file with sequences according to given criteria:
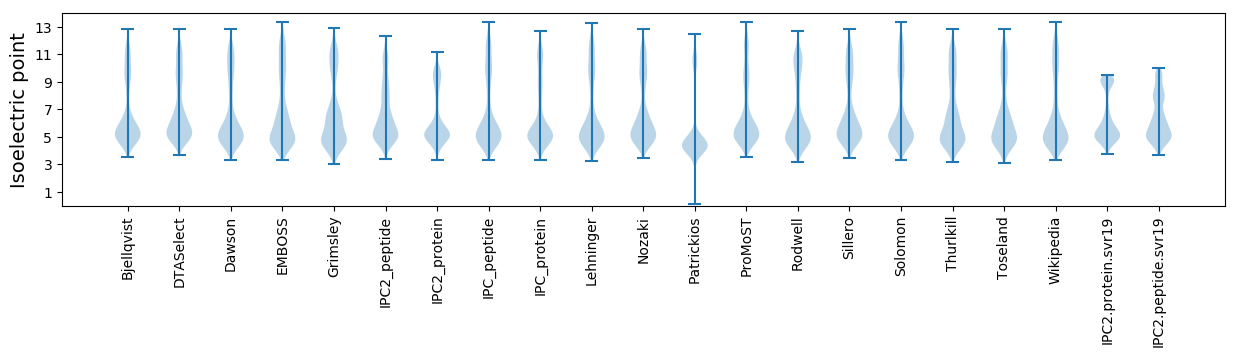
* You can choose from 21 different methods for calculating isoelectric point
Summary statistics related to proteome-wise predictions
Protein with the lowest isoelectric point:
>tr|A0A7C8BNH5|A0A7C8BNH5_9MICO Ribose-5-phosphate isomerase OS=Pseudoclavibacter caeni OX=908846 GN=F8O02_04380 PE=3 SV=1
MM1 pKa = 7.33SLYY4 pKa = 10.79AVTYY8 pKa = 10.13VYY10 pKa = 10.53IDD12 pKa = 4.31DD13 pKa = 4.81DD14 pKa = 4.1AALAATRR21 pKa = 11.84PEE23 pKa = 3.51HH24 pKa = 6.47RR25 pKa = 11.84AYY27 pKa = 11.02LSGLQQNGQNLASGPLAVPGPNSALLILQADD58 pKa = 4.51SIEE61 pKa = 4.16QAAALSDD68 pKa = 4.56DD69 pKa = 4.41DD70 pKa = 4.81PMVASGLVTEE80 pKa = 4.87RR81 pKa = 11.84HH82 pKa = 4.43IQAWNIVIGGLGDD95 pKa = 3.39
MM1 pKa = 7.33SLYY4 pKa = 10.79AVTYY8 pKa = 10.13VYY10 pKa = 10.53IDD12 pKa = 4.31DD13 pKa = 4.81DD14 pKa = 4.1AALAATRR21 pKa = 11.84PEE23 pKa = 3.51HH24 pKa = 6.47RR25 pKa = 11.84AYY27 pKa = 11.02LSGLQQNGQNLASGPLAVPGPNSALLILQADD58 pKa = 4.51SIEE61 pKa = 4.16QAAALSDD68 pKa = 4.56DD69 pKa = 4.41DD70 pKa = 4.81PMVASGLVTEE80 pKa = 4.87RR81 pKa = 11.84HH82 pKa = 4.43IQAWNIVIGGLGDD95 pKa = 3.39
Molecular weight: 9.95 kDa
Isoelectric point according different methods:
Protein with the highest isoelectric point:
>tr|A0A7C8FUT7|A0A7C8FUT7_9MICO Phosphomannomutase OS=Pseudoclavibacter caeni OX=908846 GN=F8O02_00145 PE=3 SV=1
MM1 pKa = 7.4GSVIKK6 pKa = 10.42KK7 pKa = 8.47RR8 pKa = 11.84RR9 pKa = 11.84KK10 pKa = 9.22RR11 pKa = 11.84MAKK14 pKa = 9.41KK15 pKa = 9.87KK16 pKa = 9.7HH17 pKa = 5.84RR18 pKa = 11.84KK19 pKa = 8.56LLRR22 pKa = 11.84KK23 pKa = 7.78TRR25 pKa = 11.84HH26 pKa = 3.65QRR28 pKa = 11.84RR29 pKa = 11.84NKK31 pKa = 9.78KK32 pKa = 9.85
MM1 pKa = 7.4GSVIKK6 pKa = 10.42KK7 pKa = 8.47RR8 pKa = 11.84RR9 pKa = 11.84KK10 pKa = 9.22RR11 pKa = 11.84MAKK14 pKa = 9.41KK15 pKa = 9.87KK16 pKa = 9.7HH17 pKa = 5.84RR18 pKa = 11.84KK19 pKa = 8.56LLRR22 pKa = 11.84KK23 pKa = 7.78TRR25 pKa = 11.84HH26 pKa = 3.65QRR28 pKa = 11.84RR29 pKa = 11.84NKK31 pKa = 9.78KK32 pKa = 9.85
Molecular weight: 4.08 kDa
Isoelectric point according different methods:
Peptides (in silico digests for buttom-up proteomics)
Below you can find in silico digests of the whole proteome with Trypsin, Chymotrypsin, Trypsin+LysC, LysN, ArgC proteases suitable for different mass spec machines.| Try ESI |
 |
|---|
| ChTry ESI |
|
|---|
| ArgC ESI |
|
|---|
| LysN ESI |
|
|---|
| TryLysC ESI |
|
|---|
| Try MALDI |
|
|---|
| ChTry MALDI |
|
|---|
| ArgC MALDI |
|
|---|
| LysN MALDI |
|
|---|
| TryLysC MALDI |
|
|---|
| Try LTQ |
|
|---|
| ChTry LTQ |
|
|---|
| ArgC LTQ |
|
|---|
| LysN LTQ |
|
|---|
| TryLysC LTQ |
|
|---|
| Try MSlow |
|
|---|
| ChTry MSlow |
|
|---|
| ArgC MSlow |
|
|---|
| LysN MSlow |
|
|---|
| TryLysC MSlow |
|
|---|
| Try MShigh |
|
|---|
| ChTry MShigh |
|
|---|
| ArgC MShigh |
|
|---|
| LysN MShigh |
|
|---|
| TryLysC MShigh |
|
|---|
General Statistics
Number of major isoforms |
Number of additional isoforms |
Number of all proteins |
Number of amino acids |
Min. Seq. Length |
Max. Seq. Length |
Avg. Seq. Length |
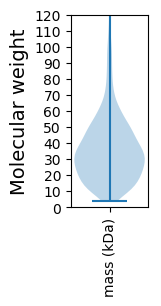
Avg. Mol. Weight |
|---|---|---|---|---|---|---|---|
0 |
596281 |
32 |
2202 |
350.8 |
37.65 |
Amino acid frequency
Ala |
Cys |
Asp |
Glu |
Phe |
Gly |
His |
Ile |
Lys |
Leu |
|---|---|---|---|---|---|---|---|---|---|
13.594 ± 0.085 | 0.563 ± 0.013 |
6.57 ± 0.043 | 5.488 ± 0.061 |
2.706 ± 0.031 | 8.921 ± 0.052 |
2.315 ± 0.024 | 4.197 ± 0.04 |
1.681 ± 0.041 | 10.157 ± 0.064 |
Met |
Asn |
Gln |
Pro |
Arg |
Ser |
Thr |
Val |
Trp |
Tyr |
|---|---|---|---|---|---|---|---|---|---|
1.729 ± 0.022 | 1.673 ± 0.028 |
5.549 ± 0.045 | 3.082 ± 0.038 |
8.474 ± 0.072 | 4.976 ± 0.047 |
6.215 ± 0.049 | 8.907 ± 0.056 |
1.408 ± 0.028 | 1.795 ± 0.028 |
Most of the basic statistics you can see at this page can be downloaded from this CSV file
See this proteome in:

Proteome-pI is available under Creative Commons Attribution-NoDerivs license, for more details see here
| Reference: Kozlowski LP. Proteome-pI 2.0: Proteome Isoelectric Point Database Update. Nucleic Acids Res. 2021, doi: 10.1093/nar/gkab944 | Contact: Lukasz P. Kozlowski |