Streptococcus satellite phage Javan500
Taxonomy: Viruses; unclassified bacterial viruses
Average proteome isoelectric point is 7.1
Get precalculated fractions of proteins
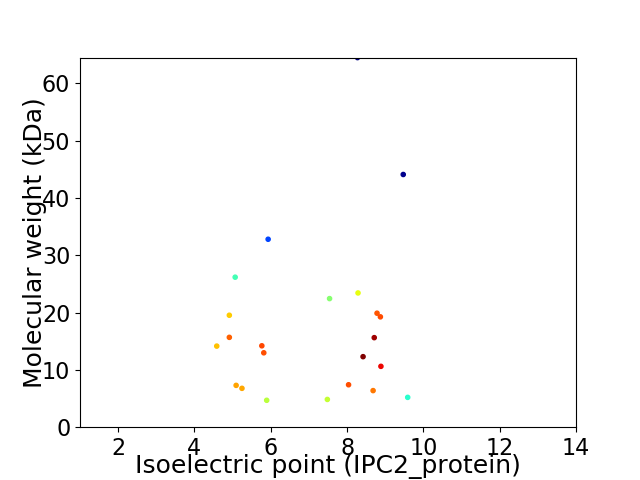
Virtual 2D-PAGE plot for 23 proteins (isoelectric point calculated using IPC2_protein)
Get csv file with sequences according to given criteria:
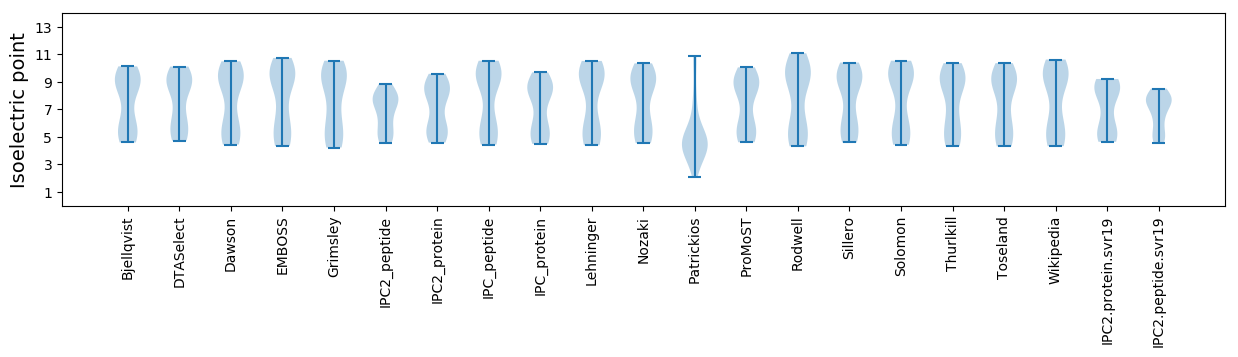
* You can choose from 21 different methods for calculating isoelectric point
Summary statistics related to proteome-wise predictions
Protein with the lowest isoelectric point:
>tr|A0A4D5ZUN4|A0A4D5ZUN4_9VIRU Uncharacterized protein OS=Streptococcus satellite phage Javan500 OX=2558726 GN=JavanS500_0021 PE=4 SV=1
MM1 pKa = 6.67MQEE4 pKa = 4.55LNLTPTQTLILFFVLGLLGLLLSLSKK30 pKa = 10.98SLIDD34 pKa = 3.72IDD36 pKa = 5.16LPEE39 pKa = 4.68DD40 pKa = 3.71TQVPKK45 pKa = 10.41PRR47 pKa = 11.84QNANYY52 pKa = 9.31GAYY55 pKa = 9.23IQSQNHH61 pKa = 5.87YY62 pKa = 9.82YY63 pKa = 10.4NN64 pKa = 3.73
MM1 pKa = 6.67MQEE4 pKa = 4.55LNLTPTQTLILFFVLGLLGLLLSLSKK30 pKa = 10.98SLIDD34 pKa = 3.72IDD36 pKa = 5.16LPEE39 pKa = 4.68DD40 pKa = 3.71TQVPKK45 pKa = 10.41PRR47 pKa = 11.84QNANYY52 pKa = 9.31GAYY55 pKa = 9.23IQSQNHH61 pKa = 5.87YY62 pKa = 9.82YY63 pKa = 10.4NN64 pKa = 3.73
Molecular weight: 7.3 kDa
Isoelectric point according different methods:
Protein with the highest isoelectric point:
>tr|A0A4D5ZQ87|A0A4D5ZQ87_9VIRU Uncharacterized protein OS=Streptococcus satellite phage Javan500 OX=2558726 GN=JavanS500_0012 PE=4 SV=1
MM1 pKa = 7.57SGGGAYY7 pKa = 9.43VCKK10 pKa = 10.2SQKK13 pKa = 9.01PKK15 pKa = 9.91EE16 pKa = 4.06RR17 pKa = 11.84RR18 pKa = 11.84RR19 pKa = 11.84QGLSVYY25 pKa = 7.65EE26 pKa = 4.27TLTLMIAFGTLIVAIMNNKK45 pKa = 8.89NKK47 pKa = 10.56
MM1 pKa = 7.57SGGGAYY7 pKa = 9.43VCKK10 pKa = 10.2SQKK13 pKa = 9.01PKK15 pKa = 9.91EE16 pKa = 4.06RR17 pKa = 11.84RR18 pKa = 11.84RR19 pKa = 11.84QGLSVYY25 pKa = 7.65EE26 pKa = 4.27TLTLMIAFGTLIVAIMNNKK45 pKa = 8.89NKK47 pKa = 10.56
Molecular weight: 5.2 kDa
Isoelectric point according different methods:
Peptides (in silico digests for buttom-up proteomics)
Below you can find in silico digests of the whole proteome with Trypsin, Chymotrypsin, Trypsin+LysC, LysN, ArgC proteases suitable for different mass spec machines.| Try ESI |
 |
|---|
| ChTry ESI |
|
|---|
| ArgC ESI |
|
|---|
| LysN ESI |
|
|---|
| TryLysC ESI |
|
|---|
| Try MALDI |
|
|---|
| ChTry MALDI |
|
|---|
| ArgC MALDI |
|
|---|
| LysN MALDI |
|
|---|
| TryLysC MALDI |
|
|---|
| Try LTQ |
|
|---|
| ChTry LTQ |
|
|---|
| ArgC LTQ |
|
|---|
| LysN LTQ |
|
|---|
| TryLysC LTQ |
|
|---|
| Try MSlow |
|
|---|
| ChTry MSlow |
|
|---|
| ArgC MSlow |
|
|---|
| LysN MSlow |
|
|---|
| TryLysC MSlow |
|
|---|
| Try MShigh |
|
|---|
| ChTry MShigh |
|
|---|
| ArgC MShigh |
|
|---|
| LysN MShigh |
|
|---|
| TryLysC MShigh |
|
|---|
General Statistics
Number of major isoforms |
Number of additional isoforms |
Number of all proteins |
Number of amino acids |
Min. Seq. Length |
Max. Seq. Length |
Avg. Seq. Length |
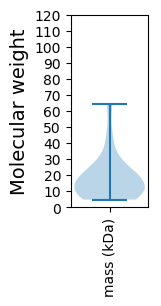
Avg. Mol. Weight |
|---|---|---|---|---|---|---|---|
0 |
3546 |
40 |
562 |
154.2 |
17.83 |
Amino acid frequency
Ala |
Cys |
Asp |
Glu |
Phe |
Gly |
His |
Ile |
Lys |
Leu |
|---|---|---|---|---|---|---|---|---|---|
5.753 ± 0.311 | 0.733 ± 0.217 |
5.64 ± 0.497 | 7.445 ± 0.543 |
4.005 ± 0.294 | 4.71 ± 0.421 |
2.087 ± 0.27 | 7.135 ± 0.347 |
9.334 ± 0.508 | 10.039 ± 0.551 |
Met |
Asn |
Gln |
Pro |
Arg |
Ser |
Thr |
Val |
Trp |
Tyr |
|---|---|---|---|---|---|---|---|---|---|
2.228 ± 0.212 | 5.048 ± 0.235 |
3.299 ± 0.462 | 4.315 ± 0.328 |
5.048 ± 0.448 | 5.386 ± 0.29 |
6.486 ± 0.384 | 5.386 ± 0.4 |
0.902 ± 0.122 | 5.02 ± 0.444 |
Most of the basic statistics you can see at this page can be downloaded from this CSV file
See this proteome in:

Proteome-pI is available under Creative Commons Attribution-NoDerivs license, for more details see here
| Reference: Kozlowski LP. Proteome-pI 2.0: Proteome Isoelectric Point Database Update. Nucleic Acids Res. 2021, doi: 10.1093/nar/gkab944 | Contact: Lukasz P. Kozlowski |