Zymobacter palmae
Taxonomy: cellular organisms; Bacteria; Proteobacteria; Gammaproteobacteria; Oceanospirillales; Halomonadaceae; Zymobacter group; Zymobacter
Average proteome isoelectric point is 6.39
Get precalculated fractions of proteins
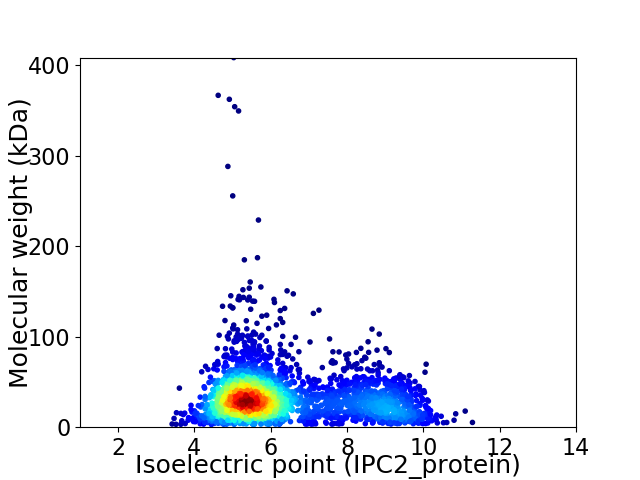
Virtual 2D-PAGE plot for 2668 proteins (isoelectric point calculated using IPC2_protein)
Get csv file with sequences according to given criteria:
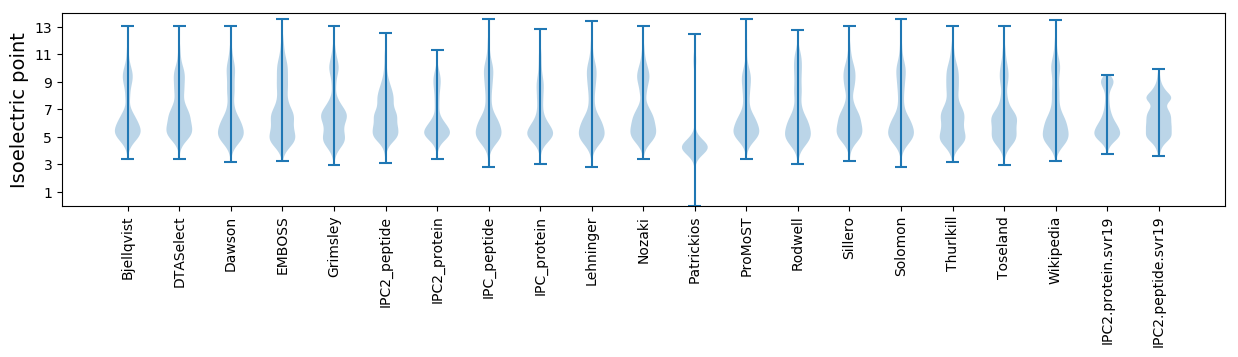
* You can choose from 21 different methods for calculating isoelectric point
Summary statistics related to proteome-wise predictions
Protein with the lowest isoelectric point:
>tr|A0A348HI68|A0A348HI68_9GAMM Lysozyme OS=Zymobacter palmae OX=33074 GN=ZBT109_2590 PE=3 SV=1
MM1 pKa = 6.24TTVVTSQQGDD11 pKa = 3.87TVDD14 pKa = 5.45LICHH18 pKa = 6.9RR19 pKa = 11.84YY20 pKa = 10.08GGTSDD25 pKa = 5.4DD26 pKa = 4.28VIAVYY31 pKa = 10.73ALNSGLCILGPVLPLGTRR49 pKa = 11.84VTLPDD54 pKa = 4.37FSTTASEE61 pKa = 4.21QTNDD65 pKa = 3.7TMLQLWDD72 pKa = 3.42
MM1 pKa = 6.24TTVVTSQQGDD11 pKa = 3.87TVDD14 pKa = 5.45LICHH18 pKa = 6.9RR19 pKa = 11.84YY20 pKa = 10.08GGTSDD25 pKa = 5.4DD26 pKa = 4.28VIAVYY31 pKa = 10.73ALNSGLCILGPVLPLGTRR49 pKa = 11.84VTLPDD54 pKa = 4.37FSTTASEE61 pKa = 4.21QTNDD65 pKa = 3.7TMLQLWDD72 pKa = 3.42
Molecular weight: 7.72 kDa
Isoelectric point according different methods:
Protein with the highest isoelectric point:
>tr|A0A348HIF4|A0A348HIF4_9GAMM Uncharacterized conserved protein OS=Zymobacter palmae OX=33074 GN=ZBT109_2681 PE=4 SV=1
MM1 pKa = 7.45KK2 pKa = 9.51RR3 pKa = 11.84TFQPSVLKK11 pKa = 10.46RR12 pKa = 11.84KK13 pKa = 9.37RR14 pKa = 11.84NHH16 pKa = 5.37GFRR19 pKa = 11.84ARR21 pKa = 11.84MATMRR26 pKa = 11.84GRR28 pKa = 11.84QVLARR33 pKa = 11.84RR34 pKa = 11.84RR35 pKa = 11.84AKK37 pKa = 9.93GRR39 pKa = 11.84KK40 pKa = 8.85RR41 pKa = 11.84LSAA44 pKa = 3.96
MM1 pKa = 7.45KK2 pKa = 9.51RR3 pKa = 11.84TFQPSVLKK11 pKa = 10.46RR12 pKa = 11.84KK13 pKa = 9.37RR14 pKa = 11.84NHH16 pKa = 5.37GFRR19 pKa = 11.84ARR21 pKa = 11.84MATMRR26 pKa = 11.84GRR28 pKa = 11.84QVLARR33 pKa = 11.84RR34 pKa = 11.84RR35 pKa = 11.84AKK37 pKa = 9.93GRR39 pKa = 11.84KK40 pKa = 8.85RR41 pKa = 11.84LSAA44 pKa = 3.96
Molecular weight: 5.27 kDa
Isoelectric point according different methods:
Peptides (in silico digests for buttom-up proteomics)
Below you can find in silico digests of the whole proteome with Trypsin, Chymotrypsin, Trypsin+LysC, LysN, ArgC proteases suitable for different mass spec machines.| Try ESI |
 |
|---|
| ChTry ESI |
|
|---|
| ArgC ESI |
|
|---|
| LysN ESI |
|
|---|
| TryLysC ESI |
|
|---|
| Try MALDI |
|
|---|
| ChTry MALDI |
|
|---|
| ArgC MALDI |
|
|---|
| LysN MALDI |
|
|---|
| TryLysC MALDI |
|
|---|
| Try LTQ |
|
|---|
| ChTry LTQ |
|
|---|
| ArgC LTQ |
|
|---|
| LysN LTQ |
|
|---|
| TryLysC LTQ |
|
|---|
| Try MSlow |
|
|---|
| ChTry MSlow |
|
|---|
| ArgC MSlow |
|
|---|
| LysN MSlow |
|
|---|
| TryLysC MSlow |
|
|---|
| Try MShigh |
|
|---|
| ChTry MShigh |
|
|---|
| ArgC MShigh |
|
|---|
| LysN MShigh |
|
|---|
| TryLysC MShigh |
|
|---|
General Statistics
Number of major isoforms |
Number of additional isoforms |
Number of all proteins |
Number of amino acids |
Min. Seq. Length |
Max. Seq. Length |
Avg. Seq. Length |
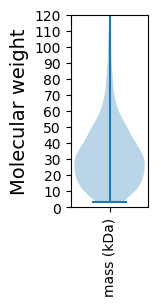
Avg. Mol. Weight |
|---|---|---|---|---|---|---|---|
0 |
844825 |
30 |
3735 |
316.7 |
34.92 |
Amino acid frequency
Ala |
Cys |
Asp |
Glu |
Phe |
Gly |
His |
Ile |
Lys |
Leu |
|---|---|---|---|---|---|---|---|---|---|
10.59 ± 0.059 | 1.189 ± 0.021 |
5.906 ± 0.041 | 5.496 ± 0.048 |
3.451 ± 0.039 | 7.38 ± 0.05 |
2.849 ± 0.03 | 5.173 ± 0.046 |
3.102 ± 0.042 | 10.575 ± 0.064 |
Met |
Asn |
Gln |
Pro |
Arg |
Ser |
Thr |
Val |
Trp |
Tyr |
|---|---|---|---|---|---|---|---|---|---|
2.704 ± 0.03 | 2.968 ± 0.042 |
4.648 ± 0.044 | 4.606 ± 0.039 |
6.822 ± 0.05 | 5.983 ± 0.055 |
5.614 ± 0.044 | 7.009 ± 0.041 |
1.377 ± 0.021 | 2.559 ± 0.025 |
Most of the basic statistics you can see at this page can be downloaded from this CSV file
See this proteome in:

Proteome-pI is available under Creative Commons Attribution-NoDerivs license, for more details see here
| Reference: Kozlowski LP. Proteome-pI 2.0: Proteome Isoelectric Point Database Update. Nucleic Acids Res. 2021, doi: 10.1093/nar/gkab944 | Contact: Lukasz P. Kozlowski |