Roseburia sp. CAG:303
Taxonomy: cellular organisms; Bacteria; Terrabacteria group; Firmicutes; Clostridia; Eubacteriales; Lachnospiraceae; Roseburia; environmental samples
Average proteome isoelectric point is 5.88
Get precalculated fractions of proteins
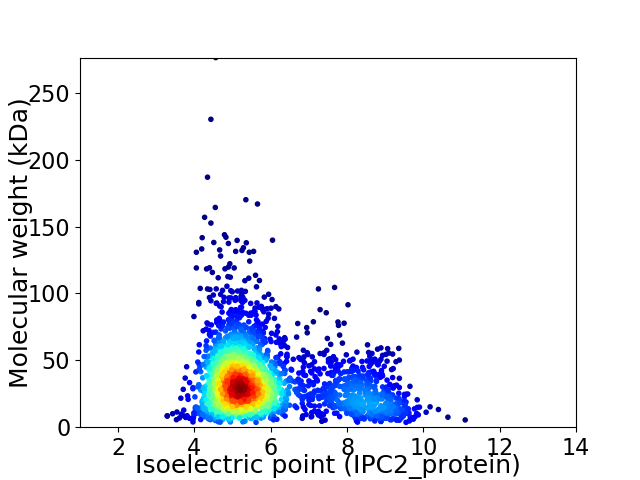
Virtual 2D-PAGE plot for 2401 proteins (isoelectric point calculated using IPC2_protein)
Get csv file with sequences according to given criteria:
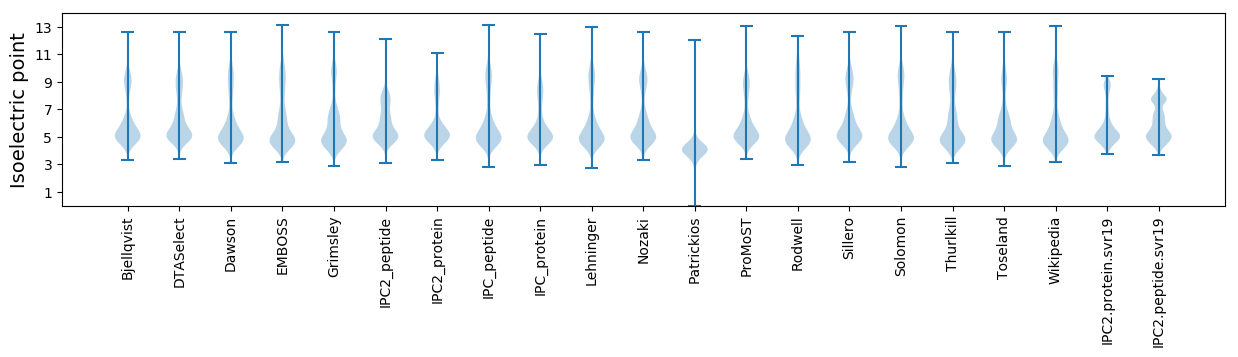
* You can choose from 21 different methods for calculating isoelectric point
Summary statistics related to proteome-wise predictions
Protein with the lowest isoelectric point:
>tr|R7IQT2|R7IQT2_9FIRM Aspartokinase OS=Roseburia sp. CAG:303 OX=1262944 GN=BN596_01988 PE=3 SV=1
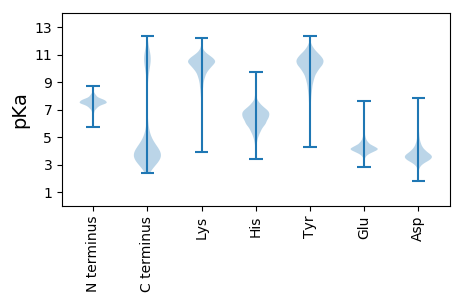
MM1 pKa = 7.39NKK3 pKa = 9.58RR4 pKa = 11.84MRR6 pKa = 11.84NMLVLSGVCVLCFAGYY22 pKa = 9.58GISVAMQKK30 pKa = 8.9DD31 pKa = 3.82TSQEE35 pKa = 3.92EE36 pKa = 4.32EE37 pKa = 4.11KK38 pKa = 10.74SEE40 pKa = 4.04KK41 pKa = 10.6LFAVSADD48 pKa = 4.46DD49 pKa = 3.5ITQITYY55 pKa = 9.09NWQEE59 pKa = 3.78EE60 pKa = 4.48EE61 pKa = 3.87IALEE65 pKa = 4.09KK66 pKa = 11.01DD67 pKa = 3.53GNDD70 pKa = 3.15WQYY73 pKa = 11.89KK74 pKa = 8.39EE75 pKa = 5.19DD76 pKa = 3.87AAFSLNQTMAEE87 pKa = 4.21TMSEE91 pKa = 4.07ALSGAEE97 pKa = 3.65VLQKK101 pKa = 10.19IEE103 pKa = 4.41EE104 pKa = 4.31KK105 pKa = 10.88DD106 pKa = 3.17VDD108 pKa = 4.07LQSFGLEE115 pKa = 4.16TPALAVTFSDD125 pKa = 4.97GDD127 pKa = 3.77GQQYY131 pKa = 10.18QLSFGNYY138 pKa = 5.83NTAAKK143 pKa = 10.13GYY145 pKa = 9.36YY146 pKa = 10.09AMKK149 pKa = 10.64NDD151 pKa = 4.27DD152 pKa = 3.83GCVYY156 pKa = 10.01MVDD159 pKa = 4.1SEE161 pKa = 4.67TMTDD165 pKa = 4.53FEE167 pKa = 4.73YY168 pKa = 11.31GLYY171 pKa = 10.57DD172 pKa = 4.81LLVLDD177 pKa = 5.97EE178 pKa = 4.99IPSVDD183 pKa = 3.46ADD185 pKa = 3.93YY186 pKa = 11.67VSGITISDD194 pKa = 3.46SGKK197 pKa = 6.65TTEE200 pKa = 3.78YY201 pKa = 9.4TYY203 pKa = 10.58QIEE206 pKa = 4.35EE207 pKa = 4.25VQEE210 pKa = 3.94EE211 pKa = 4.7TTQEE215 pKa = 3.93EE216 pKa = 4.79TSASQVVWYY225 pKa = 9.82AWDD228 pKa = 3.6GTDD231 pKa = 5.51KK232 pKa = 10.81VRR234 pKa = 11.84CDD236 pKa = 3.19STEE239 pKa = 3.8FAEE242 pKa = 4.66LTDD245 pKa = 4.81EE246 pKa = 4.06ILKK249 pKa = 10.47ISASNAADD257 pKa = 3.64YY258 pKa = 11.14NAGSAEE264 pKa = 4.29KK265 pKa = 10.57LSEE268 pKa = 4.16TYY270 pKa = 10.81GIADD274 pKa = 3.65RR275 pKa = 11.84MITVNYY281 pKa = 9.8VDD283 pKa = 5.29ADD285 pKa = 3.62TDD287 pKa = 3.59EE288 pKa = 4.93DD289 pKa = 3.84KK290 pKa = 11.3SYY292 pKa = 9.23TLHH295 pKa = 6.72FGSSDD300 pKa = 3.4GAGNVYY306 pKa = 7.99MTVDD310 pKa = 4.59DD311 pKa = 4.3SMQVQLVEE319 pKa = 4.12EE320 pKa = 4.33SLVNSIFGEE329 pKa = 4.65GNN331 pKa = 2.94
MM1 pKa = 7.39NKK3 pKa = 9.58RR4 pKa = 11.84MRR6 pKa = 11.84NMLVLSGVCVLCFAGYY22 pKa = 9.58GISVAMQKK30 pKa = 8.9DD31 pKa = 3.82TSQEE35 pKa = 3.92EE36 pKa = 4.32EE37 pKa = 4.11KK38 pKa = 10.74SEE40 pKa = 4.04KK41 pKa = 10.6LFAVSADD48 pKa = 4.46DD49 pKa = 3.5ITQITYY55 pKa = 9.09NWQEE59 pKa = 3.78EE60 pKa = 4.48EE61 pKa = 3.87IALEE65 pKa = 4.09KK66 pKa = 11.01DD67 pKa = 3.53GNDD70 pKa = 3.15WQYY73 pKa = 11.89KK74 pKa = 8.39EE75 pKa = 5.19DD76 pKa = 3.87AAFSLNQTMAEE87 pKa = 4.21TMSEE91 pKa = 4.07ALSGAEE97 pKa = 3.65VLQKK101 pKa = 10.19IEE103 pKa = 4.41EE104 pKa = 4.31KK105 pKa = 10.88DD106 pKa = 3.17VDD108 pKa = 4.07LQSFGLEE115 pKa = 4.16TPALAVTFSDD125 pKa = 4.97GDD127 pKa = 3.77GQQYY131 pKa = 10.18QLSFGNYY138 pKa = 5.83NTAAKK143 pKa = 10.13GYY145 pKa = 9.36YY146 pKa = 10.09AMKK149 pKa = 10.64NDD151 pKa = 4.27DD152 pKa = 3.83GCVYY156 pKa = 10.01MVDD159 pKa = 4.1SEE161 pKa = 4.67TMTDD165 pKa = 4.53FEE167 pKa = 4.73YY168 pKa = 11.31GLYY171 pKa = 10.57DD172 pKa = 4.81LLVLDD177 pKa = 5.97EE178 pKa = 4.99IPSVDD183 pKa = 3.46ADD185 pKa = 3.93YY186 pKa = 11.67VSGITISDD194 pKa = 3.46SGKK197 pKa = 6.65TTEE200 pKa = 3.78YY201 pKa = 9.4TYY203 pKa = 10.58QIEE206 pKa = 4.35EE207 pKa = 4.25VQEE210 pKa = 3.94EE211 pKa = 4.7TTQEE215 pKa = 3.93EE216 pKa = 4.79TSASQVVWYY225 pKa = 9.82AWDD228 pKa = 3.6GTDD231 pKa = 5.51KK232 pKa = 10.81VRR234 pKa = 11.84CDD236 pKa = 3.19STEE239 pKa = 3.8FAEE242 pKa = 4.66LTDD245 pKa = 4.81EE246 pKa = 4.06ILKK249 pKa = 10.47ISASNAADD257 pKa = 3.64YY258 pKa = 11.14NAGSAEE264 pKa = 4.29KK265 pKa = 10.57LSEE268 pKa = 4.16TYY270 pKa = 10.81GIADD274 pKa = 3.65RR275 pKa = 11.84MITVNYY281 pKa = 9.8VDD283 pKa = 5.29ADD285 pKa = 3.62TDD287 pKa = 3.59EE288 pKa = 4.93DD289 pKa = 3.84KK290 pKa = 11.3SYY292 pKa = 9.23TLHH295 pKa = 6.72FGSSDD300 pKa = 3.4GAGNVYY306 pKa = 7.99MTVDD310 pKa = 4.59DD311 pKa = 4.3SMQVQLVEE319 pKa = 4.12EE320 pKa = 4.33SLVNSIFGEE329 pKa = 4.65GNN331 pKa = 2.94
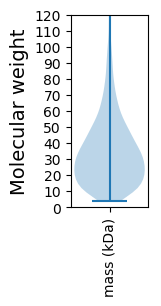
Molecular weight: 36.73 kDa
Isoelectric point according different methods:
Protein with the highest isoelectric point:
>tr|R7IWL2|R7IWL2_9FIRM DNA-binding response regulator OS=Roseburia sp. CAG:303 OX=1262944 GN=BN596_00578 PE=4 SV=1
MM1 pKa = 7.3RR2 pKa = 11.84QTMGVTYY9 pKa = 10.27NPKK12 pKa = 9.4KK13 pKa = 9.16RR14 pKa = 11.84ARR16 pKa = 11.84AKK18 pKa = 9.24VHH20 pKa = 5.63GFRR23 pKa = 11.84ARR25 pKa = 11.84MSTANGRR32 pKa = 11.84KK33 pKa = 8.89VLAARR38 pKa = 11.84RR39 pKa = 11.84AKK41 pKa = 9.63GRR43 pKa = 11.84KK44 pKa = 9.18RR45 pKa = 11.84ISAA48 pKa = 3.72
MM1 pKa = 7.3RR2 pKa = 11.84QTMGVTYY9 pKa = 10.27NPKK12 pKa = 9.4KK13 pKa = 9.16RR14 pKa = 11.84ARR16 pKa = 11.84AKK18 pKa = 9.24VHH20 pKa = 5.63GFRR23 pKa = 11.84ARR25 pKa = 11.84MSTANGRR32 pKa = 11.84KK33 pKa = 8.89VLAARR38 pKa = 11.84RR39 pKa = 11.84AKK41 pKa = 9.63GRR43 pKa = 11.84KK44 pKa = 9.18RR45 pKa = 11.84ISAA48 pKa = 3.72
Molecular weight: 5.44 kDa
Isoelectric point according different methods:
Peptides (in silico digests for buttom-up proteomics)
Below you can find in silico digests of the whole proteome with Trypsin, Chymotrypsin, Trypsin+LysC, LysN, ArgC proteases suitable for different mass spec machines.| Try ESI |
 |
|---|
| ChTry ESI |
|
|---|
| ArgC ESI |
|
|---|
| LysN ESI |
|
|---|
| TryLysC ESI |
|
|---|
| Try MALDI |
|
|---|
| ChTry MALDI |
|
|---|
| ArgC MALDI |
|
|---|
| LysN MALDI |
|
|---|
| TryLysC MALDI |
|
|---|
| Try LTQ |
|
|---|
| ChTry LTQ |
|
|---|
| ArgC LTQ |
|
|---|
| LysN LTQ |
|
|---|
| TryLysC LTQ |
|
|---|
| Try MSlow |
|
|---|
| ChTry MSlow |
|
|---|
| ArgC MSlow |
|
|---|
| LysN MSlow |
|
|---|
| TryLysC MSlow |
|
|---|
| Try MShigh |
|
|---|
| ChTry MShigh |
|
|---|
| ArgC MShigh |
|
|---|
| LysN MShigh |
|
|---|
| TryLysC MShigh |
|
|---|
General Statistics
Number of major isoforms |
Number of additional isoforms |
Number of all proteins |
Number of amino acids |
Min. Seq. Length |
Max. Seq. Length |
Avg. Seq. Length |
Avg. Mol. Weight |
|---|---|---|---|---|---|---|---|
0 |
776360 |
30 |
2484 |
323.3 |
36.39 |
Amino acid frequency
Ala |
Cys |
Asp |
Glu |
Phe |
Gly |
His |
Ile |
Lys |
Leu |
|---|---|---|---|---|---|---|---|---|---|
7.147 ± 0.051 | 1.445 ± 0.022 |
5.787 ± 0.041 | 8.076 ± 0.061 |
4.007 ± 0.035 | 6.819 ± 0.044 |
1.638 ± 0.023 | 7.773 ± 0.044 |
7.279 ± 0.045 | 8.485 ± 0.048 |
Met |
Asn |
Gln |
Pro |
Arg |
Ser |
Thr |
Val |
Trp |
Tyr |
|---|---|---|---|---|---|---|---|---|---|
3.164 ± 0.026 | 4.729 ± 0.039 |
2.849 ± 0.029 | 3.252 ± 0.031 |
4.076 ± 0.037 | 5.841 ± 0.044 |
5.515 ± 0.049 | 6.84 ± 0.041 |
0.801 ± 0.019 | 4.455 ± 0.044 |
Most of the basic statistics you can see at this page can be downloaded from this CSV file
See this proteome in:

Proteome-pI is available under Creative Commons Attribution-NoDerivs license, for more details see here
| Reference: Kozlowski LP. Proteome-pI 2.0: Proteome Isoelectric Point Database Update. Nucleic Acids Res. 2021, doi: 10.1093/nar/gkab944 | Contact: Lukasz P. Kozlowski |