Clostridium sp. CAG:269
Taxonomy: cellular organisms; Bacteria; Terrabacteria group; Firmicutes; Clostridia; Eubacteriales; Clostridiaceae; Clostridium; environmental samples
Average proteome isoelectric point is 6.46
Get precalculated fractions of proteins
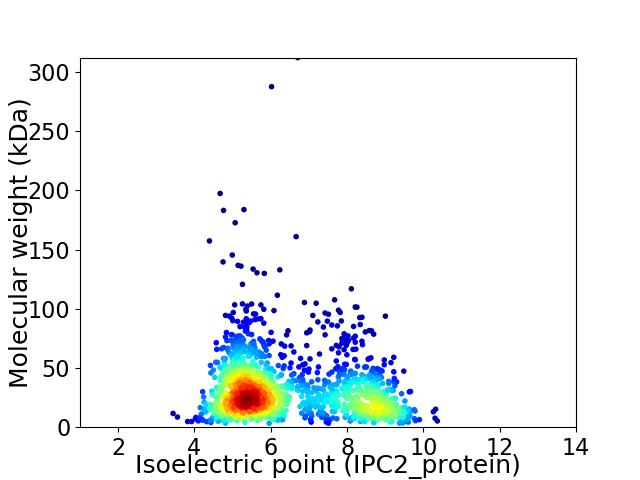
Virtual 2D-PAGE plot for 1540 proteins (isoelectric point calculated using IPC2_protein)
Get csv file with sequences according to given criteria:
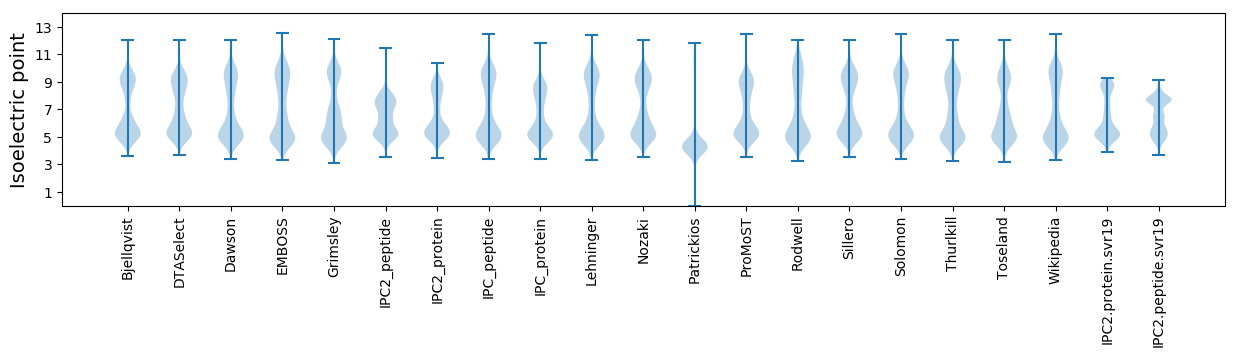
* You can choose from 21 different methods for calculating isoelectric point
Summary statistics related to proteome-wise predictions
Protein with the lowest isoelectric point:
>tr|R7IUR6|R7IUR6_9CLOT Stage II sporulation protein D OS=Clostridium sp. CAG:269 OX=1262788 GN=BN577_00549 PE=4 SV=1
MM1 pKa = 7.46NSCEE5 pKa = 4.3LVTLVSFLSCLISNSYY21 pKa = 11.01DD22 pKa = 3.56NEE24 pKa = 3.97EE25 pKa = 4.21LAVLAAVFTQLGDD38 pKa = 3.66SLATILANKK47 pKa = 9.86DD48 pKa = 3.69LLDD51 pKa = 4.13KK52 pKa = 10.88KK53 pKa = 11.08CPP55 pKa = 3.62
MM1 pKa = 7.46NSCEE5 pKa = 4.3LVTLVSFLSCLISNSYY21 pKa = 11.01DD22 pKa = 3.56NEE24 pKa = 3.97EE25 pKa = 4.21LAVLAAVFTQLGDD38 pKa = 3.66SLATILANKK47 pKa = 9.86DD48 pKa = 3.69LLDD51 pKa = 4.13KK52 pKa = 10.88KK53 pKa = 11.08CPP55 pKa = 3.62
Molecular weight: 5.94 kDa
Isoelectric point according different methods:
Protein with the highest isoelectric point:
>tr|R7IUQ2|R7IUQ2_9CLOT Uncharacterized protein OS=Clostridium sp. CAG:269 OX=1262788 GN=BN577_00652 PE=4 SV=1
MM1 pKa = 7.61AKK3 pKa = 10.14KK4 pKa = 10.19SLKK7 pKa = 10.13VKK9 pKa = 8.46QARR12 pKa = 11.84PQKK15 pKa = 9.97YY16 pKa = 7.6ATRR19 pKa = 11.84EE20 pKa = 3.81YY21 pKa = 10.63NRR23 pKa = 11.84CRR25 pKa = 11.84ICGRR29 pKa = 11.84PHH31 pKa = 7.37AYY33 pKa = 8.2IRR35 pKa = 11.84KK36 pKa = 8.51YY37 pKa = 10.46GICRR41 pKa = 11.84VCFRR45 pKa = 11.84EE46 pKa = 4.0LAHH49 pKa = 6.83KK50 pKa = 11.06GEE52 pKa = 4.16IPGVKK57 pKa = 9.3KK58 pKa = 10.94ASWW61 pKa = 3.03
MM1 pKa = 7.61AKK3 pKa = 10.14KK4 pKa = 10.19SLKK7 pKa = 10.13VKK9 pKa = 8.46QARR12 pKa = 11.84PQKK15 pKa = 9.97YY16 pKa = 7.6ATRR19 pKa = 11.84EE20 pKa = 3.81YY21 pKa = 10.63NRR23 pKa = 11.84CRR25 pKa = 11.84ICGRR29 pKa = 11.84PHH31 pKa = 7.37AYY33 pKa = 8.2IRR35 pKa = 11.84KK36 pKa = 8.51YY37 pKa = 10.46GICRR41 pKa = 11.84VCFRR45 pKa = 11.84EE46 pKa = 4.0LAHH49 pKa = 6.83KK50 pKa = 11.06GEE52 pKa = 4.16IPGVKK57 pKa = 9.3KK58 pKa = 10.94ASWW61 pKa = 3.03
Molecular weight: 7.18 kDa
Isoelectric point according different methods:
Peptides (in silico digests for buttom-up proteomics)
Below you can find in silico digests of the whole proteome with Trypsin, Chymotrypsin, Trypsin+LysC, LysN, ArgC proteases suitable for different mass spec machines.| Try ESI |
 |
|---|
| ChTry ESI |
|
|---|
| ArgC ESI |
|
|---|
| LysN ESI |
|
|---|
| TryLysC ESI |
|
|---|
| Try MALDI |
|
|---|
| ChTry MALDI |
|
|---|
| ArgC MALDI |
|
|---|
| LysN MALDI |
|
|---|
| TryLysC MALDI |
|
|---|
| Try LTQ |
|
|---|
| ChTry LTQ |
|
|---|
| ArgC LTQ |
|
|---|
| LysN LTQ |
|
|---|
| TryLysC LTQ |
|
|---|
| Try MSlow |
|
|---|
| ChTry MSlow |
|
|---|
| ArgC MSlow |
|
|---|
| LysN MSlow |
|
|---|
| TryLysC MSlow |
|
|---|
| Try MShigh |
|
|---|
| ChTry MShigh |
|
|---|
| ArgC MShigh |
|
|---|
| LysN MShigh |
|
|---|
| TryLysC MShigh |
|
|---|
General Statistics
Number of major isoforms |
Number of additional isoforms |
Number of all proteins |
Number of amino acids |
Min. Seq. Length |
Max. Seq. Length |
Avg. Seq. Length |
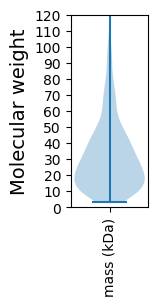
Avg. Mol. Weight |
|---|---|---|---|---|---|---|---|
0 |
451969 |
29 |
2683 |
293.5 |
33.49 |
Amino acid frequency
Ala |
Cys |
Asp |
Glu |
Phe |
Gly |
His |
Ile |
Lys |
Leu |
|---|---|---|---|---|---|---|---|---|---|
5.096 ± 0.055 | 1.094 ± 0.021 |
5.448 ± 0.043 | 8.562 ± 0.074 |
3.959 ± 0.049 | 5.631 ± 0.053 |
1.172 ± 0.023 | 10.485 ± 0.077 |
10.075 ± 0.061 | 8.203 ± 0.058 |
Met |
Asn |
Gln |
Pro |
Arg |
Ser |
Thr |
Val |
Trp |
Tyr |
|---|---|---|---|---|---|---|---|---|---|
2.507 ± 0.027 | 6.844 ± 0.066 |
2.432 ± 0.031 | 3.061 ± 0.037 |
3.24 ± 0.048 | 5.712 ± 0.054 |
5.444 ± 0.062 | 5.96 ± 0.047 |
0.654 ± 0.019 | 4.419 ± 0.045 |
Most of the basic statistics you can see at this page can be downloaded from this CSV file
See this proteome in:

Proteome-pI is available under Creative Commons Attribution-NoDerivs license, for more details see here
| Reference: Kozlowski LP. Proteome-pI 2.0: Proteome Isoelectric Point Database Update. Nucleic Acids Res. 2021, doi: 10.1093/nar/gkab944 | Contact: Lukasz P. Kozlowski |