Desulfosporosinus sp. Sb-LF
Taxonomy: cellular organisms; Bacteria; Terrabacteria group; Firmicutes; Clostridia; Eubacteriales; Peptococcaceae; Desulfosporosinus; unclassified Desulfosporosinus
Average proteome isoelectric point is 6.49
Get precalculated fractions of proteins
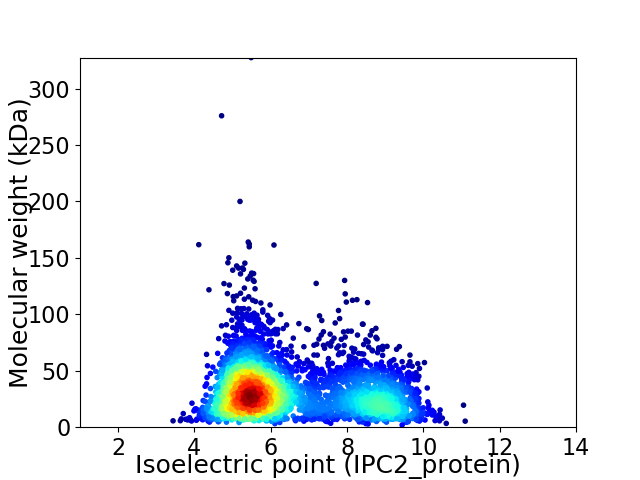
Virtual 2D-PAGE plot for 3743 proteins (isoelectric point calculated using IPC2_protein)
Get csv file with sequences according to given criteria:
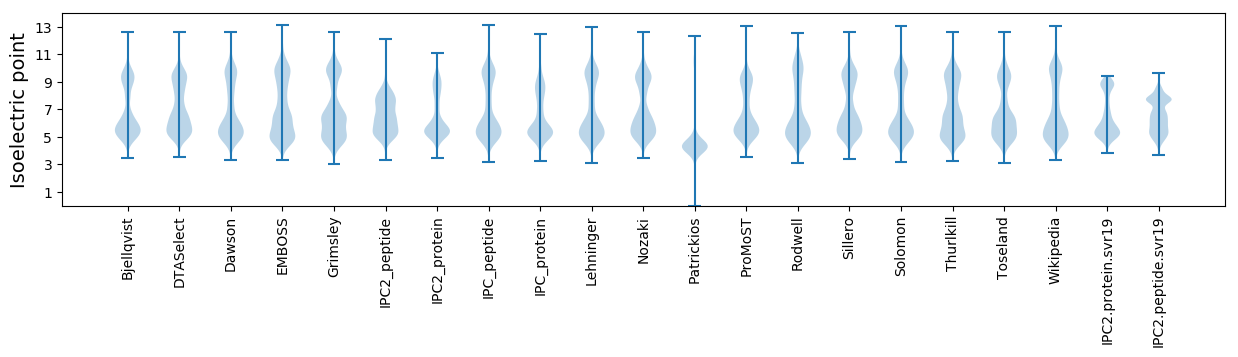
* You can choose from 21 different methods for calculating isoelectric point
Summary statistics related to proteome-wise predictions
Protein with the lowest isoelectric point:
>tr|A0A4Z0QRB1|A0A4Z0QRB1_9FIRM Bacillithiol biosynthesis deacetylase BshB2 OS=Desulfosporosinus sp. Sb-LF OX=2560027 GN=bshB2 PE=4 SV=1
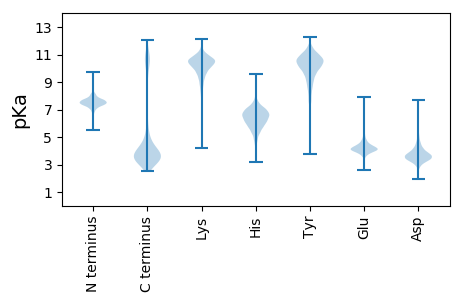
MM1 pKa = 7.28IAAVDD6 pKa = 3.59KK7 pKa = 8.54DD8 pKa = 3.75TCIGCGACPEE18 pKa = 4.36FCPEE22 pKa = 3.95VFKK25 pKa = 11.29MEE27 pKa = 4.85DD28 pKa = 3.24DD29 pKa = 4.18GLAVAYY35 pKa = 7.35TNPIPSDD42 pKa = 3.46VEE44 pKa = 4.0AAAKK48 pKa = 10.08DD49 pKa = 3.65AADD52 pKa = 4.28GCPVDD57 pKa = 5.44AIHH60 pKa = 7.29VNGG63 pKa = 4.12
MM1 pKa = 7.28IAAVDD6 pKa = 3.59KK7 pKa = 8.54DD8 pKa = 3.75TCIGCGACPEE18 pKa = 4.36FCPEE22 pKa = 3.95VFKK25 pKa = 11.29MEE27 pKa = 4.85DD28 pKa = 3.24DD29 pKa = 4.18GLAVAYY35 pKa = 7.35TNPIPSDD42 pKa = 3.46VEE44 pKa = 4.0AAAKK48 pKa = 10.08DD49 pKa = 3.65AADD52 pKa = 4.28GCPVDD57 pKa = 5.44AIHH60 pKa = 7.29VNGG63 pKa = 4.12
Molecular weight: 6.44 kDa
Isoelectric point according different methods:
Protein with the highest isoelectric point:
>tr|A0A4Z0QUI4|A0A4Z0QUI4_9FIRM SdpI family protein OS=Desulfosporosinus sp. Sb-LF OX=2560027 GN=E4K68_05520 PE=4 SV=1
MM1 pKa = 7.36KK2 pKa = 9.44RR3 pKa = 11.84TYY5 pKa = 9.19QPKK8 pKa = 8.78NRR10 pKa = 11.84RR11 pKa = 11.84HH12 pKa = 5.44KK13 pKa = 10.09RR14 pKa = 11.84VHH16 pKa = 5.93GFLSRR21 pKa = 11.84MSTPTGRR28 pKa = 11.84NVLKK32 pKa = 10.51RR33 pKa = 11.84RR34 pKa = 11.84RR35 pKa = 11.84LKK37 pKa = 10.57GRR39 pKa = 11.84KK40 pKa = 8.8KK41 pKa = 10.81LSVV44 pKa = 3.15
MM1 pKa = 7.36KK2 pKa = 9.44RR3 pKa = 11.84TYY5 pKa = 9.19QPKK8 pKa = 8.78NRR10 pKa = 11.84RR11 pKa = 11.84HH12 pKa = 5.44KK13 pKa = 10.09RR14 pKa = 11.84VHH16 pKa = 5.93GFLSRR21 pKa = 11.84MSTPTGRR28 pKa = 11.84NVLKK32 pKa = 10.51RR33 pKa = 11.84RR34 pKa = 11.84RR35 pKa = 11.84LKK37 pKa = 10.57GRR39 pKa = 11.84KK40 pKa = 8.8KK41 pKa = 10.81LSVV44 pKa = 3.15
Molecular weight: 5.36 kDa
Isoelectric point according different methods:
Peptides (in silico digests for buttom-up proteomics)
Below you can find in silico digests of the whole proteome with Trypsin, Chymotrypsin, Trypsin+LysC, LysN, ArgC proteases suitable for different mass spec machines.| Try ESI |
 |
|---|
| ChTry ESI |
|
|---|
| ArgC ESI |
|
|---|
| LysN ESI |
|
|---|
| TryLysC ESI |
|
|---|
| Try MALDI |
|
|---|
| ChTry MALDI |
|
|---|
| ArgC MALDI |
|
|---|
| LysN MALDI |
|
|---|
| TryLysC MALDI |
|
|---|
| Try LTQ |
|
|---|
| ChTry LTQ |
|
|---|
| ArgC LTQ |
|
|---|
| LysN LTQ |
|
|---|
| TryLysC LTQ |
|
|---|
| Try MSlow |
|
|---|
| ChTry MSlow |
|
|---|
| ArgC MSlow |
|
|---|
| LysN MSlow |
|
|---|
| TryLysC MSlow |
|
|---|
| Try MShigh |
|
|---|
| ChTry MShigh |
|
|---|
| ArgC MShigh |
|
|---|
| LysN MShigh |
|
|---|
| TryLysC MShigh |
|
|---|
General Statistics
Number of major isoforms |
Number of additional isoforms |
Number of all proteins |
Number of amino acids |
Min. Seq. Length |
Max. Seq. Length |
Avg. Seq. Length |
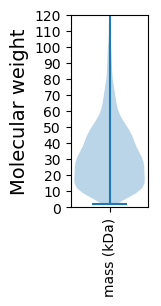
Avg. Mol. Weight |
|---|---|---|---|---|---|---|---|
0 |
1146958 |
17 |
2864 |
306.4 |
34.03 |
Amino acid frequency
Ala |
Cys |
Asp |
Glu |
Phe |
Gly |
His |
Ile |
Lys |
Leu |
|---|---|---|---|---|---|---|---|---|---|
7.638 ± 0.047 | 1.094 ± 0.018 |
4.865 ± 0.03 | 6.678 ± 0.054 |
4.038 ± 0.031 | 7.57 ± 0.044 |
1.921 ± 0.017 | 7.373 ± 0.04 |
5.949 ± 0.038 | 10.413 ± 0.047 |
Met |
Asn |
Gln |
Pro |
Arg |
Ser |
Thr |
Val |
Trp |
Tyr |
|---|---|---|---|---|---|---|---|---|---|
2.688 ± 0.017 | 4.095 ± 0.026 |
3.933 ± 0.026 | 3.796 ± 0.029 |
4.737 ± 0.038 | 6.145 ± 0.034 |
5.524 ± 0.045 | 7.372 ± 0.034 |
1.077 ± 0.017 | 3.092 ± 0.024 |
Most of the basic statistics you can see at this page can be downloaded from this CSV file
See this proteome in:

Proteome-pI is available under Creative Commons Attribution-NoDerivs license, for more details see here
| Reference: Kozlowski LP. Proteome-pI 2.0: Proteome Isoelectric Point Database Update. Nucleic Acids Res. 2021, doi: 10.1093/nar/gkab944 | Contact: Lukasz P. Kozlowski |