Marinibacterium profundimaris
Taxonomy: cellular organisms; Bacteria; Proteobacteria; Alphaproteobacteria; Rhodobacterales; Rhodobacteraceae; Marinibacterium
Average proteome isoelectric point is 5.97
Get precalculated fractions of proteins
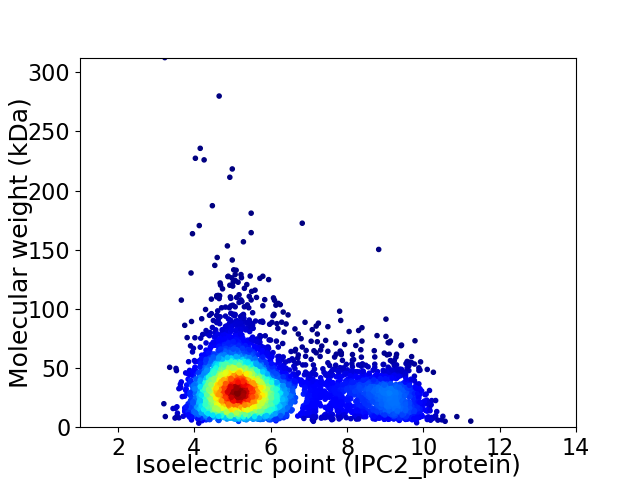
Virtual 2D-PAGE plot for 5086 proteins (isoelectric point calculated using IPC2_protein)
Get csv file with sequences according to given criteria:
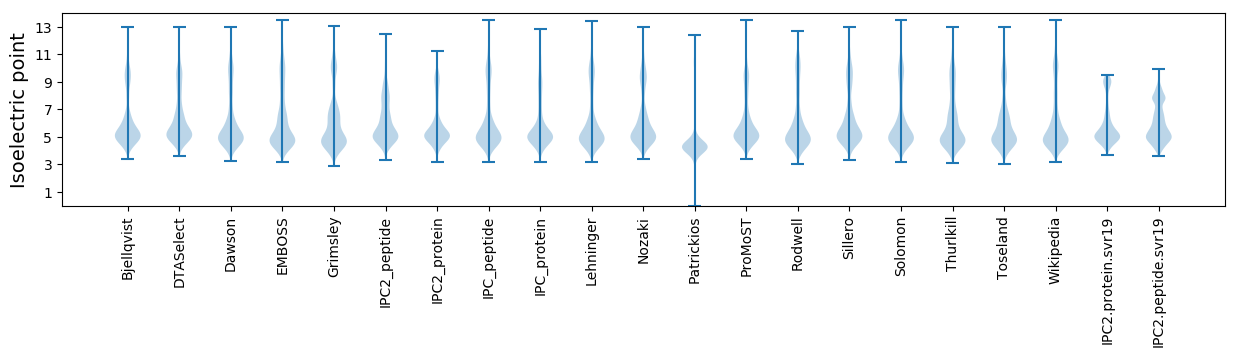
* You can choose from 21 different methods for calculating isoelectric point
Summary statistics related to proteome-wise predictions
Protein with the lowest isoelectric point:
>tr|A0A225NMM7|A0A225NMM7_9RHOB Uncharacterized protein OS=Marinibacterium profundimaris OX=1679460 GN=ATO3_16680 PE=4 SV=1
MM1 pKa = 7.7KK2 pKa = 8.99KK3 pKa = 8.29TLFTSTALVLLAGAAAAQVSFSGYY27 pKa = 9.81GRR29 pKa = 11.84FGLGYY34 pKa = 10.13QEE36 pKa = 5.28DD37 pKa = 4.14RR38 pKa = 11.84QITDD42 pKa = 2.66INGDD46 pKa = 3.52VTDD49 pKa = 4.11TDD51 pKa = 3.51VSLVSRR57 pKa = 11.84FRR59 pKa = 11.84LNIDD63 pKa = 3.4GMAVTDD69 pKa = 3.86GGVEE73 pKa = 4.25FSARR77 pKa = 11.84VRR79 pKa = 11.84LQADD83 pKa = 3.59DD84 pKa = 4.46SPAFNEE90 pKa = 4.06QNSASLNGARR100 pKa = 11.84YY101 pKa = 8.52SVQYY105 pKa = 10.92GGFRR109 pKa = 11.84VDD111 pKa = 3.43AGNVAGSFDD120 pKa = 4.34NMPNYY125 pKa = 10.68YY126 pKa = 10.27GFEE129 pKa = 4.59PGLEE133 pKa = 4.09AFTGQYY139 pKa = 9.93TGVDD143 pKa = 3.91YY144 pKa = 11.45DD145 pKa = 3.88FLAYY149 pKa = 10.48SSTGSGSNAVYY160 pKa = 10.55ASYY163 pKa = 9.07TAGGFFFGASYY174 pKa = 10.6DD175 pKa = 3.71QEE177 pKa = 5.18AFLDD181 pKa = 3.6NDD183 pKa = 3.13RR184 pKa = 11.84WDD186 pKa = 3.19IGGSYY191 pKa = 9.1TFNNFTAALTYY202 pKa = 10.64GEE204 pKa = 4.54NEE206 pKa = 3.69IDD208 pKa = 3.39QSLLVFTLGADD219 pKa = 4.02FDD221 pKa = 4.58RR222 pKa = 11.84FSGTLFVGDD231 pKa = 4.55EE232 pKa = 4.51DD233 pKa = 5.44LDD235 pKa = 4.27LAAGAPDD242 pKa = 3.29IDD244 pKa = 3.65GTVYY248 pKa = 10.88GLSLSFDD255 pKa = 3.33VGAATSILASYY266 pKa = 7.92GTGTGDD272 pKa = 5.68DD273 pKa = 3.96DD274 pKa = 5.0DD275 pKa = 4.79EE276 pKa = 6.95GYY278 pKa = 11.29GVAFVHH284 pKa = 6.95DD285 pKa = 4.62LGGGVSLKK293 pKa = 10.91GGIGAEE299 pKa = 4.38GPKK302 pKa = 10.11DD303 pKa = 3.6DD304 pKa = 4.9SYY306 pKa = 11.67MVGDD310 pKa = 4.74LGVLFNFF317 pKa = 4.97
MM1 pKa = 7.7KK2 pKa = 8.99KK3 pKa = 8.29TLFTSTALVLLAGAAAAQVSFSGYY27 pKa = 9.81GRR29 pKa = 11.84FGLGYY34 pKa = 10.13QEE36 pKa = 5.28DD37 pKa = 4.14RR38 pKa = 11.84QITDD42 pKa = 2.66INGDD46 pKa = 3.52VTDD49 pKa = 4.11TDD51 pKa = 3.51VSLVSRR57 pKa = 11.84FRR59 pKa = 11.84LNIDD63 pKa = 3.4GMAVTDD69 pKa = 3.86GGVEE73 pKa = 4.25FSARR77 pKa = 11.84VRR79 pKa = 11.84LQADD83 pKa = 3.59DD84 pKa = 4.46SPAFNEE90 pKa = 4.06QNSASLNGARR100 pKa = 11.84YY101 pKa = 8.52SVQYY105 pKa = 10.92GGFRR109 pKa = 11.84VDD111 pKa = 3.43AGNVAGSFDD120 pKa = 4.34NMPNYY125 pKa = 10.68YY126 pKa = 10.27GFEE129 pKa = 4.59PGLEE133 pKa = 4.09AFTGQYY139 pKa = 9.93TGVDD143 pKa = 3.91YY144 pKa = 11.45DD145 pKa = 3.88FLAYY149 pKa = 10.48SSTGSGSNAVYY160 pKa = 10.55ASYY163 pKa = 9.07TAGGFFFGASYY174 pKa = 10.6DD175 pKa = 3.71QEE177 pKa = 5.18AFLDD181 pKa = 3.6NDD183 pKa = 3.13RR184 pKa = 11.84WDD186 pKa = 3.19IGGSYY191 pKa = 9.1TFNNFTAALTYY202 pKa = 10.64GEE204 pKa = 4.54NEE206 pKa = 3.69IDD208 pKa = 3.39QSLLVFTLGADD219 pKa = 4.02FDD221 pKa = 4.58RR222 pKa = 11.84FSGTLFVGDD231 pKa = 4.55EE232 pKa = 4.51DD233 pKa = 5.44LDD235 pKa = 4.27LAAGAPDD242 pKa = 3.29IDD244 pKa = 3.65GTVYY248 pKa = 10.88GLSLSFDD255 pKa = 3.33VGAATSILASYY266 pKa = 7.92GTGTGDD272 pKa = 5.68DD273 pKa = 3.96DD274 pKa = 5.0DD275 pKa = 4.79EE276 pKa = 6.95GYY278 pKa = 11.29GVAFVHH284 pKa = 6.95DD285 pKa = 4.62LGGGVSLKK293 pKa = 10.91GGIGAEE299 pKa = 4.38GPKK302 pKa = 10.11DD303 pKa = 3.6DD304 pKa = 4.9SYY306 pKa = 11.67MVGDD310 pKa = 4.74LGVLFNFF317 pKa = 4.97
Molecular weight: 33.4 kDa
Isoelectric point according different methods:
Protein with the highest isoelectric point:
>tr|A0A225NQN9|A0A225NQN9_9RHOB Riboflavin synthase subunit alpha OS=Marinibacterium profundimaris OX=1679460 GN=ATO3_10995 PE=4 SV=1
MM1 pKa = 7.45KK2 pKa = 9.61RR3 pKa = 11.84TFQPSNLVRR12 pKa = 11.84KK13 pKa = 9.18RR14 pKa = 11.84RR15 pKa = 11.84HH16 pKa = 4.42GFRR19 pKa = 11.84ARR21 pKa = 11.84MATKK25 pKa = 10.37AGRR28 pKa = 11.84KK29 pKa = 8.54ILNARR34 pKa = 11.84RR35 pKa = 11.84ARR37 pKa = 11.84GRR39 pKa = 11.84KK40 pKa = 9.07SLSAA44 pKa = 3.93
MM1 pKa = 7.45KK2 pKa = 9.61RR3 pKa = 11.84TFQPSNLVRR12 pKa = 11.84KK13 pKa = 9.18RR14 pKa = 11.84RR15 pKa = 11.84HH16 pKa = 4.42GFRR19 pKa = 11.84ARR21 pKa = 11.84MATKK25 pKa = 10.37AGRR28 pKa = 11.84KK29 pKa = 8.54ILNARR34 pKa = 11.84RR35 pKa = 11.84ARR37 pKa = 11.84GRR39 pKa = 11.84KK40 pKa = 9.07SLSAA44 pKa = 3.93
Molecular weight: 5.14 kDa
Isoelectric point according different methods:
Peptides (in silico digests for buttom-up proteomics)
Below you can find in silico digests of the whole proteome with Trypsin, Chymotrypsin, Trypsin+LysC, LysN, ArgC proteases suitable for different mass spec machines.| Try ESI |
 |
|---|
| ChTry ESI |
|
|---|
| ArgC ESI |
|
|---|
| LysN ESI |
|
|---|
| TryLysC ESI |
|
|---|
| Try MALDI |
|
|---|
| ChTry MALDI |
|
|---|
| ArgC MALDI |
|
|---|
| LysN MALDI |
|
|---|
| TryLysC MALDI |
|
|---|
| Try LTQ |
|
|---|
| ChTry LTQ |
|
|---|
| ArgC LTQ |
|
|---|
| LysN LTQ |
|
|---|
| TryLysC LTQ |
|
|---|
| Try MSlow |
|
|---|
| ChTry MSlow |
|
|---|
| ArgC MSlow |
|
|---|
| LysN MSlow |
|
|---|
| TryLysC MSlow |
|
|---|
| Try MShigh |
|
|---|
| ChTry MShigh |
|
|---|
| ArgC MShigh |
|
|---|
| LysN MShigh |
|
|---|
| TryLysC MShigh |
|
|---|
General Statistics
Number of major isoforms |
Number of additional isoforms |
Number of all proteins |
Number of amino acids |
Min. Seq. Length |
Max. Seq. Length |
Avg. Seq. Length |
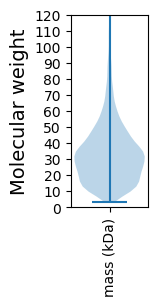
Avg. Mol. Weight |
|---|---|---|---|---|---|---|---|
0 |
1621870 |
31 |
3016 |
318.9 |
34.56 |
Amino acid frequency
Ala |
Cys |
Asp |
Glu |
Phe |
Gly |
His |
Ile |
Lys |
Leu |
|---|---|---|---|---|---|---|---|---|---|
12.406 ± 0.051 | 0.879 ± 0.011 |
6.2 ± 0.031 | 6.018 ± 0.032 |
3.652 ± 0.023 | 8.945 ± 0.045 |
2.018 ± 0.017 | 5.038 ± 0.029 |
2.711 ± 0.027 | 10.096 ± 0.044 |
Met |
Asn |
Gln |
Pro |
Arg |
Ser |
Thr |
Val |
Trp |
Tyr |
|---|---|---|---|---|---|---|---|---|---|
2.824 ± 0.015 | 2.352 ± 0.019 |
5.336 ± 0.029 | 3.049 ± 0.018 |
6.947 ± 0.037 | 5.03 ± 0.029 |
5.524 ± 0.024 | 7.318 ± 0.024 |
1.429 ± 0.016 | 2.228 ± 0.017 |
Most of the basic statistics you can see at this page can be downloaded from this CSV file
See this proteome in:

Proteome-pI is available under Creative Commons Attribution-NoDerivs license, for more details see here
| Reference: Kozlowski LP. Proteome-pI 2.0: Proteome Isoelectric Point Database Update. Nucleic Acids Res. 2021, doi: 10.1093/nar/gkab944 | Contact: Lukasz P. Kozlowski |