Geobacillus sp. (strain WCH70)
Taxonomy: cellular organisms; Bacteria; Terrabacteria group; Firmicutes; Bacilli; Bacillales; Bacillaceae; Geobacillus; unclassified Geobacillus
Average proteome isoelectric point is 6.72
Get precalculated fractions of proteins
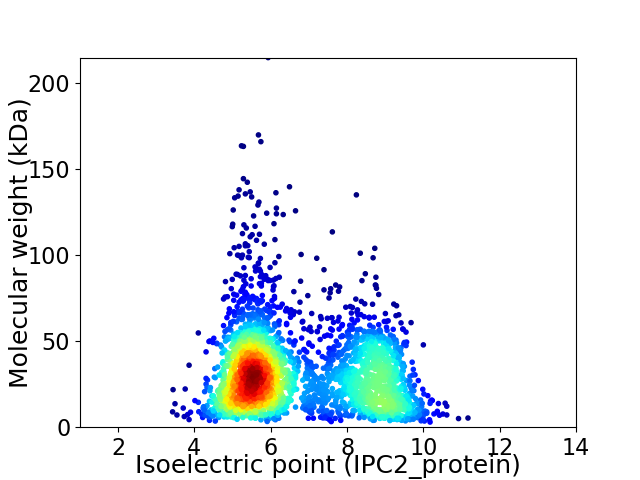
Virtual 2D-PAGE plot for 3048 proteins (isoelectric point calculated using IPC2_protein)
Get csv file with sequences according to given criteria:
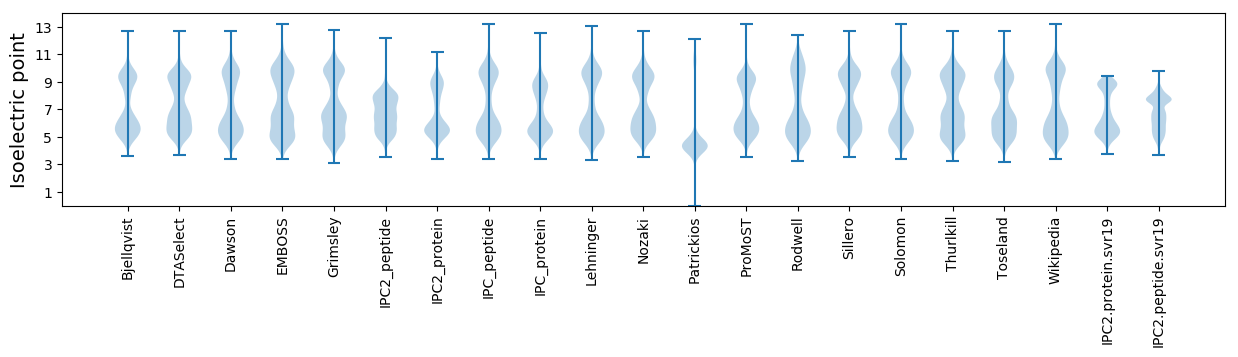
* You can choose from 21 different methods for calculating isoelectric point
Summary statistics related to proteome-wise predictions
Protein with the lowest isoelectric point:
>tr|C5DA41|C5DA41_GEOSW Uncharacterized protein OS=Geobacillus sp. (strain WCH70) OX=471223 GN=GWCH70_1307 PE=4 SV=1
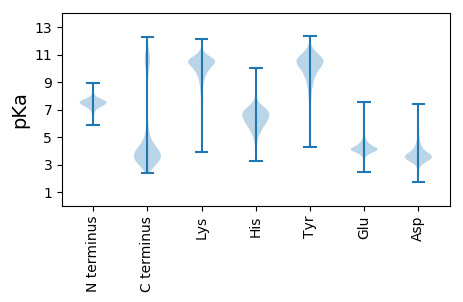
MM1 pKa = 7.65IIASNIEE8 pKa = 4.06EE9 pKa = 4.48IEE11 pKa = 4.16NAFDD15 pKa = 3.63FTDD18 pKa = 4.37SIITGVKK25 pKa = 9.53CVNHH29 pKa = 6.02LTDD32 pKa = 4.45LSISVDD38 pKa = 4.37YY39 pKa = 11.17YY40 pKa = 10.81WDD42 pKa = 3.48IQDD45 pKa = 4.5GKK47 pKa = 11.04SEE49 pKa = 4.37TIIDD53 pKa = 3.86APP55 pKa = 3.91
MM1 pKa = 7.65IIASNIEE8 pKa = 4.06EE9 pKa = 4.48IEE11 pKa = 4.16NAFDD15 pKa = 3.63FTDD18 pKa = 4.37SIITGVKK25 pKa = 9.53CVNHH29 pKa = 6.02LTDD32 pKa = 4.45LSISVDD38 pKa = 4.37YY39 pKa = 11.17YY40 pKa = 10.81WDD42 pKa = 3.48IQDD45 pKa = 4.5GKK47 pKa = 11.04SEE49 pKa = 4.37TIIDD53 pKa = 3.86APP55 pKa = 3.91
Molecular weight: 6.16 kDa
Isoelectric point according different methods:
Protein with the highest isoelectric point:
>tr|C5DA04|C5DA04_GEOSW SpoOM family protein OS=Geobacillus sp. (strain WCH70) OX=471223 GN=GWCH70_1266 PE=4 SV=1
MM1 pKa = 7.35KK2 pKa = 9.42RR3 pKa = 11.84TYY5 pKa = 10.34QPNKK9 pKa = 8.21RR10 pKa = 11.84KK11 pKa = 9.62RR12 pKa = 11.84SKK14 pKa = 9.83VHH16 pKa = 5.77GFRR19 pKa = 11.84ARR21 pKa = 11.84MSTRR25 pKa = 11.84NGRR28 pKa = 11.84KK29 pKa = 8.3VLARR33 pKa = 11.84RR34 pKa = 11.84RR35 pKa = 11.84RR36 pKa = 11.84KK37 pKa = 9.05GRR39 pKa = 11.84KK40 pKa = 8.7VLSAA44 pKa = 4.05
MM1 pKa = 7.35KK2 pKa = 9.42RR3 pKa = 11.84TYY5 pKa = 10.34QPNKK9 pKa = 8.21RR10 pKa = 11.84KK11 pKa = 9.62RR12 pKa = 11.84SKK14 pKa = 9.83VHH16 pKa = 5.77GFRR19 pKa = 11.84ARR21 pKa = 11.84MSTRR25 pKa = 11.84NGRR28 pKa = 11.84KK29 pKa = 8.3VLARR33 pKa = 11.84RR34 pKa = 11.84RR35 pKa = 11.84RR36 pKa = 11.84KK37 pKa = 9.05GRR39 pKa = 11.84KK40 pKa = 8.7VLSAA44 pKa = 4.05
Molecular weight: 5.32 kDa
Isoelectric point according different methods:
Peptides (in silico digests for buttom-up proteomics)
Below you can find in silico digests of the whole proteome with Trypsin, Chymotrypsin, Trypsin+LysC, LysN, ArgC proteases suitable for different mass spec machines.| Try ESI |
 |
|---|
| ChTry ESI |
|
|---|
| ArgC ESI |
|
|---|
| LysN ESI |
|
|---|
| TryLysC ESI |
|
|---|
| Try MALDI |
|
|---|
| ChTry MALDI |
|
|---|
| ArgC MALDI |
|
|---|
| LysN MALDI |
|
|---|
| TryLysC MALDI |
|
|---|
| Try LTQ |
|
|---|
| ChTry LTQ |
|
|---|
| ArgC LTQ |
|
|---|
| LysN LTQ |
|
|---|
| TryLysC LTQ |
|
|---|
| Try MSlow |
|
|---|
| ChTry MSlow |
|
|---|
| ArgC MSlow |
|
|---|
| LysN MSlow |
|
|---|
| TryLysC MSlow |
|
|---|
| Try MShigh |
|
|---|
| ChTry MShigh |
|
|---|
| ArgC MShigh |
|
|---|
| LysN MShigh |
|
|---|
| TryLysC MShigh |
|
|---|
General Statistics
Number of major isoforms |
Number of additional isoforms |
Number of all proteins |
Number of amino acids |
Min. Seq. Length |
Max. Seq. Length |
Avg. Seq. Length |
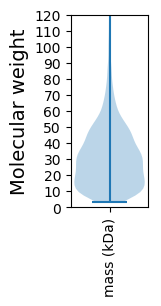
Avg. Mol. Weight |
|---|---|---|---|---|---|---|---|
0 |
882799 |
26 |
1892 |
289.6 |
32.72 |
Amino acid frequency
Ala |
Cys |
Asp |
Glu |
Phe |
Gly |
His |
Ile |
Lys |
Leu |
|---|---|---|---|---|---|---|---|---|---|
7.552 ± 0.049 | 0.837 ± 0.014 |
4.731 ± 0.032 | 7.68 ± 0.051 |
4.419 ± 0.036 | 6.594 ± 0.04 |
2.339 ± 0.022 | 7.636 ± 0.042 |
6.952 ± 0.044 | 9.709 ± 0.051 |
Met |
Asn |
Gln |
Pro |
Arg |
Ser |
Thr |
Val |
Trp |
Tyr |
|---|---|---|---|---|---|---|---|---|---|
2.712 ± 0.022 | 3.748 ± 0.032 |
3.84 ± 0.03 | 3.975 ± 0.038 |
5.021 ± 0.034 | 5.173 ± 0.027 |
5.154 ± 0.027 | 7.201 ± 0.038 |
1.094 ± 0.018 | 3.635 ± 0.025 |
Most of the basic statistics you can see at this page can be downloaded from this CSV file
See this proteome in:

Proteome-pI is available under Creative Commons Attribution-NoDerivs license, for more details see here
| Reference: Kozlowski LP. Proteome-pI 2.0: Proteome Isoelectric Point Database Update. Nucleic Acids Res. 2021, doi: 10.1093/nar/gkab944 | Contact: Lukasz P. Kozlowski |