Salmonella phage vB_SenS_AG11
Taxonomy: Viruses; Duplodnaviria; Heunggongvirae; Uroviricota; Caudoviricetes; Caudovirales; Siphoviridae; Guernseyvirinae; Jerseyvirus; Salmonella virus AG11
Average proteome isoelectric point is 6.41
Get precalculated fractions of proteins
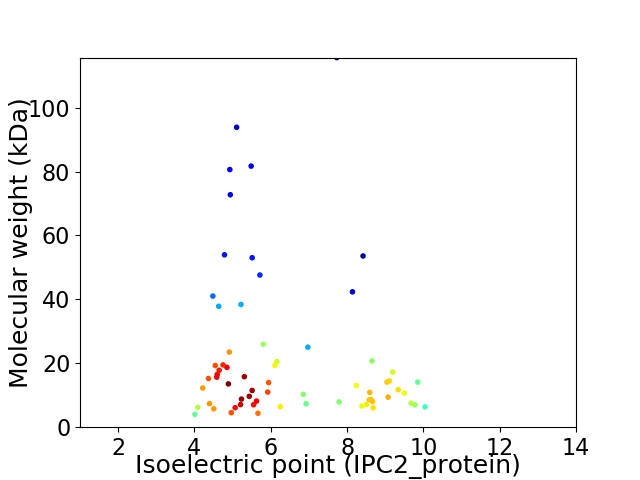
Virtual 2D-PAGE plot for 66 proteins (isoelectric point calculated using IPC2_protein)
Get csv file with sequences according to given criteria:
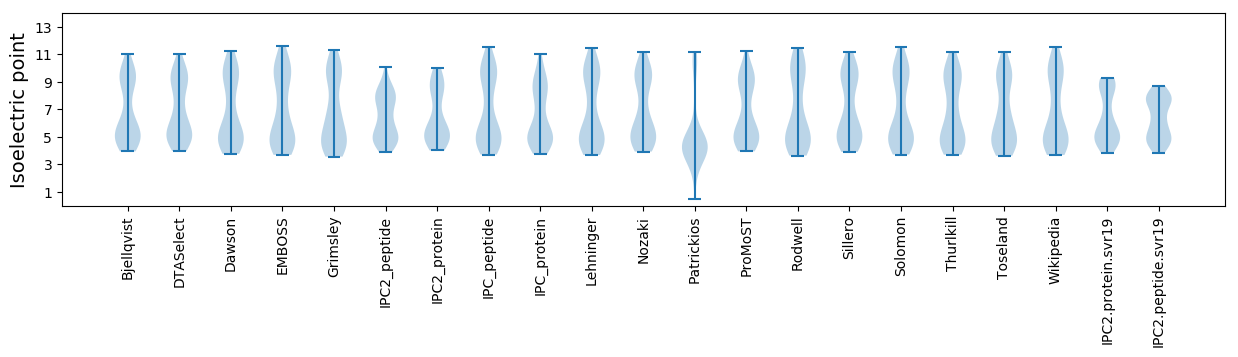
* You can choose from 21 different methods for calculating isoelectric point
Summary statistics related to proteome-wise predictions
Protein with the lowest isoelectric point:
>tr|S4SGH6|S4SGH6_9CAUD Uncharacterized protein OS=Salmonella phage vB_SenS_AG11 OX=1211279 GN=AG11_56 PE=4 SV=1
MM1 pKa = 7.41EE2 pKa = 5.55LVHH5 pKa = 7.33DD6 pKa = 4.6IDD8 pKa = 4.86DD9 pKa = 4.24ASEE12 pKa = 4.06AMALTANGAHH22 pKa = 6.62EE23 pKa = 4.48EE24 pKa = 4.35YY25 pKa = 9.98IGASMLPGIQGLYY38 pKa = 10.07
MM1 pKa = 7.41EE2 pKa = 5.55LVHH5 pKa = 7.33DD6 pKa = 4.6IDD8 pKa = 4.86DD9 pKa = 4.24ASEE12 pKa = 4.06AMALTANGAHH22 pKa = 6.62EE23 pKa = 4.48EE24 pKa = 4.35YY25 pKa = 9.98IGASMLPGIQGLYY38 pKa = 10.07
Molecular weight: 4.03 kDa
Isoelectric point according different methods:
Protein with the highest isoelectric point:
>tr|S4SGS1|S4SGS1_9CAUD Putative holin-like class I OS=Salmonella phage vB_SenS_AG11 OX=1211279 GN=AG11_57 PE=4 SV=1
MM1 pKa = 7.61KK2 pKa = 10.34PNDD5 pKa = 3.53LVTWAGRR12 pKa = 11.84NGEE15 pKa = 4.18TRR17 pKa = 11.84HH18 pKa = 5.66GKK20 pKa = 8.01VTALQGIYY28 pKa = 10.7ARR30 pKa = 11.84VEE32 pKa = 3.33WWRR35 pKa = 11.84AHH37 pKa = 5.21AKK39 pKa = 9.39KK40 pKa = 9.94PRR42 pKa = 11.84YY43 pKa = 8.21LTVRR47 pKa = 11.84RR48 pKa = 11.84DD49 pKa = 3.49KK50 pKa = 11.41LIVKK54 pKa = 9.6
MM1 pKa = 7.61KK2 pKa = 10.34PNDD5 pKa = 3.53LVTWAGRR12 pKa = 11.84NGEE15 pKa = 4.18TRR17 pKa = 11.84HH18 pKa = 5.66GKK20 pKa = 8.01VTALQGIYY28 pKa = 10.7ARR30 pKa = 11.84VEE32 pKa = 3.33WWRR35 pKa = 11.84AHH37 pKa = 5.21AKK39 pKa = 9.39KK40 pKa = 9.94PRR42 pKa = 11.84YY43 pKa = 8.21LTVRR47 pKa = 11.84RR48 pKa = 11.84DD49 pKa = 3.49KK50 pKa = 11.41LIVKK54 pKa = 9.6
Molecular weight: 6.37 kDa
Isoelectric point according different methods:
Peptides (in silico digests for buttom-up proteomics)
Below you can find in silico digests of the whole proteome with Trypsin, Chymotrypsin, Trypsin+LysC, LysN, ArgC proteases suitable for different mass spec machines.| Try ESI |
 |
|---|
| ChTry ESI |
|
|---|
| ArgC ESI |
|
|---|
| LysN ESI |
|
|---|
| TryLysC ESI |
|
|---|
| Try MALDI |
|
|---|
| ChTry MALDI |
|
|---|
| ArgC MALDI |
|
|---|
| LysN MALDI |
|
|---|
| TryLysC MALDI |
|
|---|
| Try LTQ |
|
|---|
| ChTry LTQ |
|
|---|
| ArgC LTQ |
|
|---|
| LysN LTQ |
|
|---|
| TryLysC LTQ |
|
|---|
| Try MSlow |
|
|---|
| ChTry MSlow |
|
|---|
| ArgC MSlow |
|
|---|
| LysN MSlow |
|
|---|
| TryLysC MSlow |
|
|---|
| Try MShigh |
|
|---|
| ChTry MShigh |
|
|---|
| ArgC MShigh |
|
|---|
| LysN MShigh |
|
|---|
| TryLysC MShigh |
|
|---|
General Statistics
Number of major isoforms |
Number of additional isoforms |
Number of all proteins |
Number of amino acids |
Min. Seq. Length |
Max. Seq. Length |
Avg. Seq. Length |
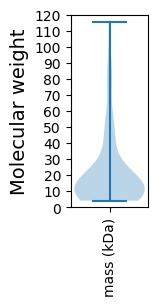
Avg. Mol. Weight |
|---|---|---|---|---|---|---|---|
0 |
13005 |
36 |
1032 |
197.0 |
21.83 |
Amino acid frequency
Ala |
Cys |
Asp |
Glu |
Phe |
Gly |
His |
Ile |
Lys |
Leu |
|---|---|---|---|---|---|---|---|---|---|
9.765 ± 0.679 | 1.015 ± 0.151 |
6.136 ± 0.26 | 6.636 ± 0.372 |
3.683 ± 0.181 | 7.712 ± 0.32 |
1.676 ± 0.196 | 4.852 ± 0.194 |
5.913 ± 0.331 | 7.782 ± 0.286 |
Met |
Asn |
Gln |
Pro |
Arg |
Ser |
Thr |
Val |
Trp |
Tyr |
|---|---|---|---|---|---|---|---|---|---|
2.722 ± 0.181 | 4.275 ± 0.211 |
3.945 ± 0.228 | 3.783 ± 0.391 |
5.698 ± 0.207 | 5.821 ± 0.25 |
6.459 ± 0.327 | 7.282 ± 0.334 |
1.453 ± 0.167 | 3.391 ± 0.199 |
Most of the basic statistics you can see at this page can be downloaded from this CSV file
See this proteome in:

Proteome-pI is available under Creative Commons Attribution-NoDerivs license, for more details see here
| Reference: Kozlowski LP. Proteome-pI 2.0: Proteome Isoelectric Point Database Update. Nucleic Acids Res. 2021, doi: 10.1093/nar/gkab944 | Contact: Lukasz P. Kozlowski |