Achromobacter phage vB_AxyS_19-32_Axy16
Taxonomy: Viruses; Duplodnaviria; Heunggongvirae; Uroviricota; Caudoviricetes; Caudovirales; Siphoviridae; Steinhofvirus; unclassified Steinhofvirus
Average proteome isoelectric point is 6.53
Get precalculated fractions of proteins
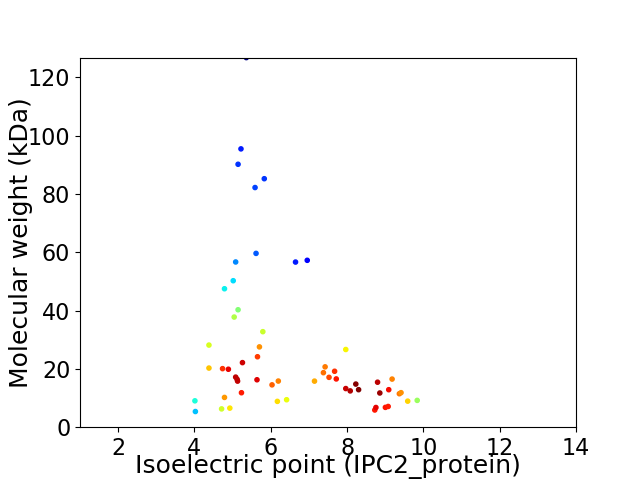
Virtual 2D-PAGE plot for 58 proteins (isoelectric point calculated using IPC2_protein)
Get csv file with sequences according to given criteria:
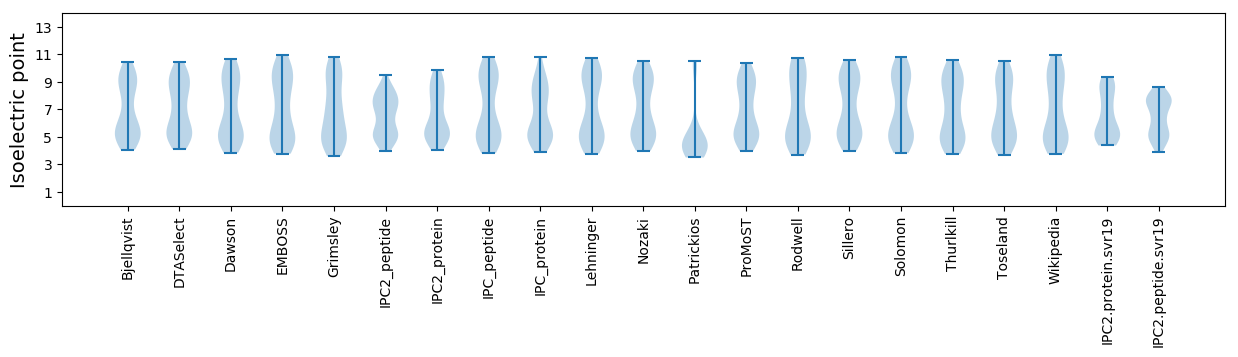
* You can choose from 21 different methods for calculating isoelectric point
Summary statistics related to proteome-wise predictions
Protein with the lowest isoelectric point:
>tr|A0A514CV62|A0A514CV62_9CAUD Uncharacterized protein OS=Achromobacter phage vB_AxyS_19-32_Axy16 OX=2591051 GN=Axy16_006 PE=4 SV=1
MM1 pKa = 7.83DD2 pKa = 5.07RR3 pKa = 11.84ADD5 pKa = 4.31IEE7 pKa = 4.23DD8 pKa = 3.79LQRR11 pKa = 11.84VRR13 pKa = 11.84DD14 pKa = 5.11FICNEE19 pKa = 3.72LALTDD24 pKa = 3.89EE25 pKa = 4.44MQLLVSQIEE34 pKa = 3.97LRR36 pKa = 11.84IATIEE41 pKa = 4.03VSIEE45 pKa = 3.78EE46 pKa = 4.21
MM1 pKa = 7.83DD2 pKa = 5.07RR3 pKa = 11.84ADD5 pKa = 4.31IEE7 pKa = 4.23DD8 pKa = 3.79LQRR11 pKa = 11.84VRR13 pKa = 11.84DD14 pKa = 5.11FICNEE19 pKa = 3.72LALTDD24 pKa = 3.89EE25 pKa = 4.44MQLLVSQIEE34 pKa = 3.97LRR36 pKa = 11.84IATIEE41 pKa = 4.03VSIEE45 pKa = 3.78EE46 pKa = 4.21
Molecular weight: 5.38 kDa
Isoelectric point according different methods:
Protein with the highest isoelectric point:
>tr|A0A514CV49|A0A514CV49_9CAUD Uncharacterized protein OS=Achromobacter phage vB_AxyS_19-32_Axy16 OX=2591051 GN=Axy16_053 PE=4 SV=1
MM1 pKa = 6.46VTSPKK6 pKa = 10.58LGFTDD11 pKa = 3.67IPAARR16 pKa = 11.84ALALATIEE24 pKa = 4.43QRR26 pKa = 11.84QAGQNVYY33 pKa = 10.15ISNLLPYY40 pKa = 9.98IGRR43 pKa = 11.84LNDD46 pKa = 4.32GYY48 pKa = 11.18SSQAPAGFVEE58 pKa = 4.23NALVVARR65 pKa = 11.84QVARR69 pKa = 11.84NIRR72 pKa = 11.84LLQDD76 pKa = 3.04VGKK79 pKa = 10.28SSRR82 pKa = 11.84RR83 pKa = 11.84SNN85 pKa = 3.17
MM1 pKa = 6.46VTSPKK6 pKa = 10.58LGFTDD11 pKa = 3.67IPAARR16 pKa = 11.84ALALATIEE24 pKa = 4.43QRR26 pKa = 11.84QAGQNVYY33 pKa = 10.15ISNLLPYY40 pKa = 9.98IGRR43 pKa = 11.84LNDD46 pKa = 4.32GYY48 pKa = 11.18SSQAPAGFVEE58 pKa = 4.23NALVVARR65 pKa = 11.84QVARR69 pKa = 11.84NIRR72 pKa = 11.84LLQDD76 pKa = 3.04VGKK79 pKa = 10.28SSRR82 pKa = 11.84RR83 pKa = 11.84SNN85 pKa = 3.17
Molecular weight: 9.2 kDa
Isoelectric point according different methods:
Peptides (in silico digests for buttom-up proteomics)
Below you can find in silico digests of the whole proteome with Trypsin, Chymotrypsin, Trypsin+LysC, LysN, ArgC proteases suitable for different mass spec machines.| Try ESI |
 |
|---|
| ChTry ESI |
|
|---|
| ArgC ESI |
|
|---|
| LysN ESI |
|
|---|
| TryLysC ESI |
|
|---|
| Try MALDI |
|
|---|
| ChTry MALDI |
|
|---|
| ArgC MALDI |
|
|---|
| LysN MALDI |
|
|---|
| TryLysC MALDI |
|
|---|
| Try LTQ |
|
|---|
| ChTry LTQ |
|
|---|
| ArgC LTQ |
|
|---|
| LysN LTQ |
|
|---|
| TryLysC LTQ |
|
|---|
| Try MSlow |
|
|---|
| ChTry MSlow |
|
|---|
| ArgC MSlow |
|
|---|
| LysN MSlow |
|
|---|
| TryLysC MSlow |
|
|---|
| Try MShigh |
|
|---|
| ChTry MShigh |
|
|---|
| ArgC MShigh |
|
|---|
| LysN MShigh |
|
|---|
| TryLysC MShigh |
|
|---|
General Statistics
Number of major isoforms |
Number of additional isoforms |
Number of all proteins |
Number of amino acids |
Min. Seq. Length |
Max. Seq. Length |
Avg. Seq. Length |
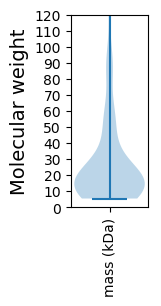
Avg. Mol. Weight |
|---|---|---|---|---|---|---|---|
0 |
14012 |
46 |
1165 |
241.6 |
26.85 |
Amino acid frequency
Ala |
Cys |
Asp |
Glu |
Phe |
Gly |
His |
Ile |
Lys |
Leu |
|---|---|---|---|---|---|---|---|---|---|
9.549 ± 0.379 | 0.871 ± 0.126 |
5.681 ± 0.27 | 6.73 ± 0.283 |
3.718 ± 0.257 | 7.85 ± 0.348 |
1.677 ± 0.201 | 5.067 ± 0.166 |
5.317 ± 0.38 | 8.207 ± 0.26 |
Met |
Asn |
Gln |
Pro |
Arg |
Ser |
Thr |
Val |
Trp |
Tyr |
|---|---|---|---|---|---|---|---|---|---|
2.833 ± 0.149 | 4.182 ± 0.291 |
5.024 ± 0.269 | 4.232 ± 0.247 |
5.852 ± 0.22 | 5.652 ± 0.205 |
5.581 ± 0.328 | 6.873 ± 0.236 |
1.906 ± 0.232 | 3.197 ± 0.178 |
Most of the basic statistics you can see at this page can be downloaded from this CSV file
See this proteome in:

Proteome-pI is available under Creative Commons Attribution-NoDerivs license, for more details see here
| Reference: Kozlowski LP. Proteome-pI 2.0: Proteome Isoelectric Point Database Update. Nucleic Acids Res. 2021, doi: 10.1093/nar/gkab944 | Contact: Lukasz P. Kozlowski |