Massilia eurypsychrophila
Taxonomy: cellular organisms; Bacteria; Proteobacteria; Betaproteobacteria; Burkholderiales; Oxalobacteraceae; Massilia
Average proteome isoelectric point is 6.85
Get precalculated fractions of proteins
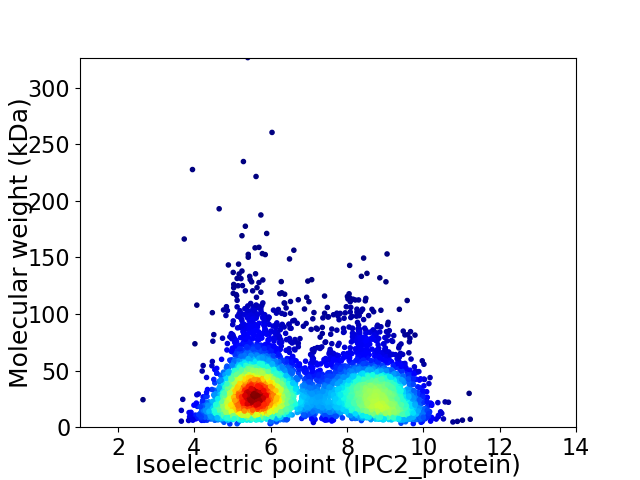
Virtual 2D-PAGE plot for 5261 proteins (isoelectric point calculated using IPC2_protein)
Get csv file with sequences according to given criteria:
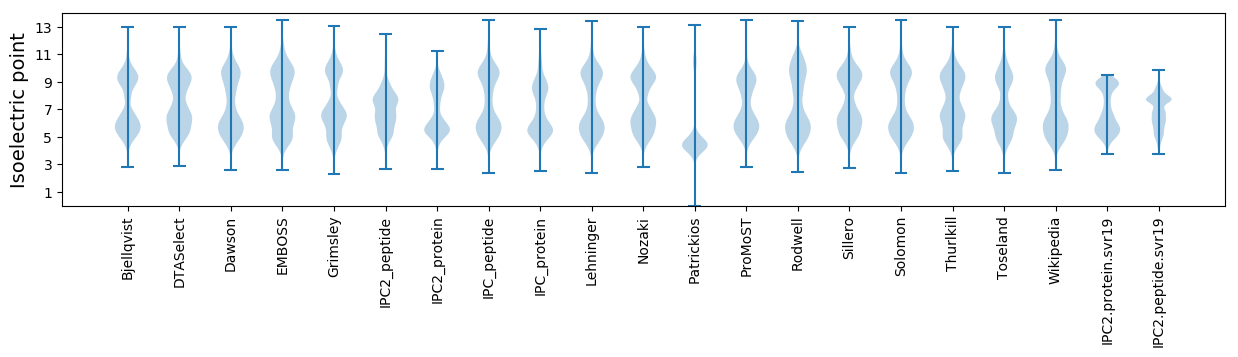
* You can choose from 21 different methods for calculating isoelectric point
Summary statistics related to proteome-wise predictions
Protein with the lowest isoelectric point:
>tr|A0A2G8TJ22|A0A2G8TJ22_9BURK Methionine aminotransferase OS=Massilia eurypsychrophila OX=1485217 GN=CR105_07840 PE=4 SV=1
MM1 pKa = 7.1LTALNALQSTAQPFTVDD18 pKa = 4.28VIDD21 pKa = 4.06VDD23 pKa = 3.94ADD25 pKa = 3.65PALVARR31 pKa = 11.84FDD33 pKa = 3.69EE34 pKa = 4.84LVPVLYY40 pKa = 10.75GDD42 pKa = 4.36LAAPEE47 pKa = 4.36LCHH50 pKa = 6.6YY51 pKa = 10.12FLDD54 pKa = 4.26AAAVRR59 pKa = 11.84AYY61 pKa = 10.22LASDD65 pKa = 3.48HH66 pKa = 6.72LSPGG70 pKa = 3.32
MM1 pKa = 7.1LTALNALQSTAQPFTVDD18 pKa = 4.28VIDD21 pKa = 4.06VDD23 pKa = 3.94ADD25 pKa = 3.65PALVARR31 pKa = 11.84FDD33 pKa = 3.69EE34 pKa = 4.84LVPVLYY40 pKa = 10.75GDD42 pKa = 4.36LAAPEE47 pKa = 4.36LCHH50 pKa = 6.6YY51 pKa = 10.12FLDD54 pKa = 4.26AAAVRR59 pKa = 11.84AYY61 pKa = 10.22LASDD65 pKa = 3.48HH66 pKa = 6.72LSPGG70 pKa = 3.32
Molecular weight: 7.46 kDa
Isoelectric point according different methods:
Protein with the highest isoelectric point:
>tr|A0A2G8TFZ6|A0A2G8TFZ6_9BURK DUF2807 domain-containing protein OS=Massilia eurypsychrophila OX=1485217 GN=CR105_10840 PE=4 SV=1
MM1 pKa = 7.51NLRR4 pKa = 11.84THH6 pKa = 6.32SRR8 pKa = 11.84PFAFAMLAMLFSLASHH24 pKa = 6.77RR25 pKa = 11.84AARR28 pKa = 11.84LQLRR32 pKa = 11.84RR33 pKa = 11.84PPAGLSGAPARR44 pKa = 11.84VRR46 pKa = 11.84RR47 pKa = 11.84LTFGNPIRR55 pKa = 11.84RR56 pKa = 11.84LGLLAGAHH64 pKa = 5.88
MM1 pKa = 7.51NLRR4 pKa = 11.84THH6 pKa = 6.32SRR8 pKa = 11.84PFAFAMLAMLFSLASHH24 pKa = 6.77RR25 pKa = 11.84AARR28 pKa = 11.84LQLRR32 pKa = 11.84RR33 pKa = 11.84PPAGLSGAPARR44 pKa = 11.84VRR46 pKa = 11.84RR47 pKa = 11.84LTFGNPIRR55 pKa = 11.84RR56 pKa = 11.84LGLLAGAHH64 pKa = 5.88
Molecular weight: 7.05 kDa
Isoelectric point according different methods:
Peptides (in silico digests for buttom-up proteomics)
Below you can find in silico digests of the whole proteome with Trypsin, Chymotrypsin, Trypsin+LysC, LysN, ArgC proteases suitable for different mass spec machines.| Try ESI |
 |
|---|
| ChTry ESI |
|
|---|
| ArgC ESI |
|
|---|
| LysN ESI |
|
|---|
| TryLysC ESI |
|
|---|
| Try MALDI |
|
|---|
| ChTry MALDI |
|
|---|
| ArgC MALDI |
|
|---|
| LysN MALDI |
|
|---|
| TryLysC MALDI |
|
|---|
| Try LTQ |
|
|---|
| ChTry LTQ |
|
|---|
| ArgC LTQ |
|
|---|
| LysN LTQ |
|
|---|
| TryLysC LTQ |
|
|---|
| Try MSlow |
|
|---|
| ChTry MSlow |
|
|---|
| ArgC MSlow |
|
|---|
| LysN MSlow |
|
|---|
| TryLysC MSlow |
|
|---|
| Try MShigh |
|
|---|
| ChTry MShigh |
|
|---|
| ArgC MShigh |
|
|---|
| LysN MShigh |
|
|---|
| TryLysC MShigh |
|
|---|
General Statistics
Number of major isoforms |
Number of additional isoforms |
Number of all proteins |
Number of amino acids |
Min. Seq. Length |
Max. Seq. Length |
Avg. Seq. Length |
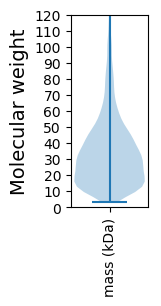
Avg. Mol. Weight |
|---|---|---|---|---|---|---|---|
0 |
1730067 |
27 |
2951 |
328.8 |
35.64 |
Amino acid frequency
Ala |
Cys |
Asp |
Glu |
Phe |
Gly |
His |
Ile |
Lys |
Leu |
|---|---|---|---|---|---|---|---|---|---|
13.035 ± 0.059 | 0.895 ± 0.012 |
5.443 ± 0.027 | 5.026 ± 0.032 |
3.647 ± 0.019 | 8.161 ± 0.034 |
2.142 ± 0.017 | 4.844 ± 0.024 |
3.644 ± 0.034 | 10.316 ± 0.042 |
Met |
Asn |
Gln |
Pro |
Arg |
Ser |
Thr |
Val |
Trp |
Tyr |
|---|---|---|---|---|---|---|---|---|---|
2.696 ± 0.017 | 2.978 ± 0.022 |
4.855 ± 0.025 | 3.797 ± 0.022 |
6.508 ± 0.033 | 5.615 ± 0.026 |
5.191 ± 0.027 | 7.501 ± 0.026 |
1.29 ± 0.013 | 2.416 ± 0.018 |
Most of the basic statistics you can see at this page can be downloaded from this CSV file
See this proteome in:

Proteome-pI is available under Creative Commons Attribution-NoDerivs license, for more details see here
| Reference: Kozlowski LP. Proteome-pI 2.0: Proteome Isoelectric Point Database Update. Nucleic Acids Res. 2021, doi: 10.1093/nar/gkab944 | Contact: Lukasz P. Kozlowski |