Rhodomicrobium vannielii (strain ATCC 17100 / ATH 3.1.1 / DSM 162 / LMG 4299)
Taxonomy: cellular organisms; Bacteria; Proteobacteria; Alphaproteobacteria; Hyphomicrobiales; Hyphomicrobiaceae; Rhodomicrobium; Rhodomicrobium vannielii
Average proteome isoelectric point is 6.75
Get precalculated fractions of proteins
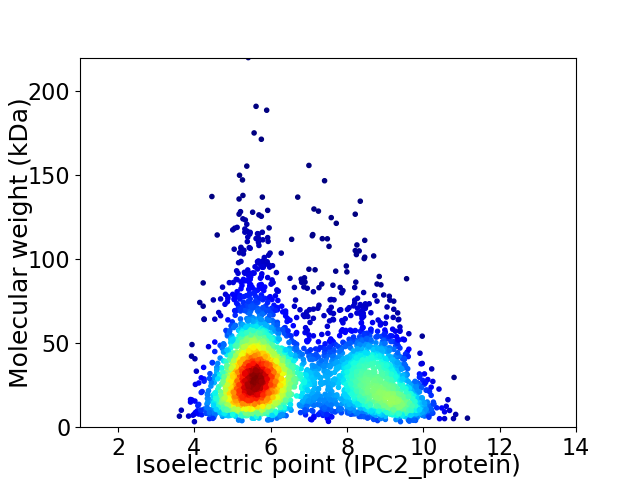
Virtual 2D-PAGE plot for 3513 proteins (isoelectric point calculated using IPC2_protein)
Get csv file with sequences according to given criteria:
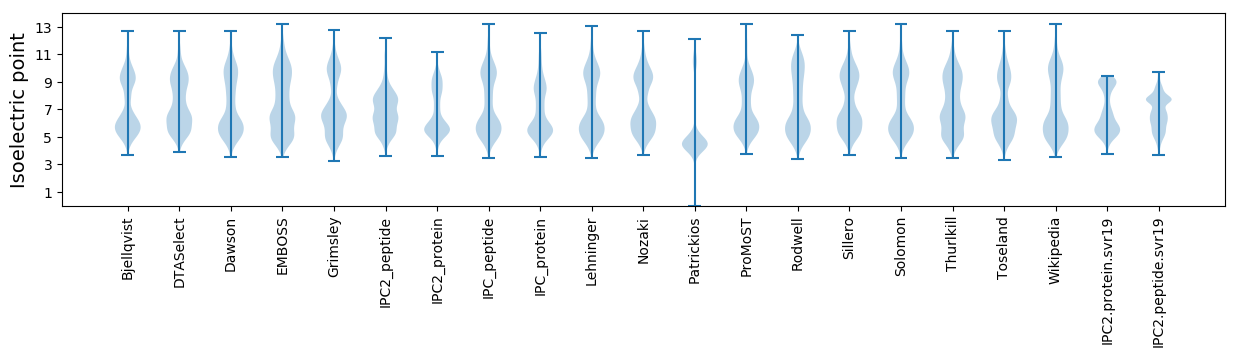
* You can choose from 21 different methods for calculating isoelectric point
Summary statistics related to proteome-wise predictions
Protein with the lowest isoelectric point:
>tr|E3I6R9|E3I6R9_RHOVT Flagellin OS=Rhodomicrobium vannielii (strain ATCC 17100 / ATH 3.1.1 / DSM 162 / LMG 4299) OX=648757 GN=Rvan_2572 PE=3 SV=1
MM1 pKa = 7.44SLYY4 pKa = 11.17GLLNTSASGMAAQSTALSTVADD26 pKa = 4.39NIANVSTTGYY36 pKa = 9.96KK37 pKa = 9.87RR38 pKa = 11.84ASTEE42 pKa = 3.46FSTLVASSGAGNYY55 pKa = 7.93QSGGVDD61 pKa = 2.66VDD63 pKa = 3.57TRR65 pKa = 11.84VAIGSQSGTTSTSSSTDD82 pKa = 3.3LAVDD86 pKa = 3.69GNGFFIVSGPNGTPALTRR104 pKa = 11.84AGSFEE109 pKa = 3.99KK110 pKa = 10.71QADD113 pKa = 3.98GTLEE117 pKa = 3.86NAAGYY122 pKa = 7.45TLLGYY127 pKa = 9.4PVGTTPSANSYY138 pKa = 11.12AGLEE142 pKa = 4.12EE143 pKa = 4.69VNISDD148 pKa = 4.64LAMKK152 pKa = 9.94AVPSTEE158 pKa = 3.79GTVTFNLPLQATAVTDD174 pKa = 3.72ATKK177 pKa = 10.79LPSANAADD185 pKa = 3.45ATYY188 pKa = 8.83TQKK191 pKa = 9.9TSFTAYY197 pKa = 10.17NNAGTAVNLDD207 pKa = 3.12AYY209 pKa = 8.04YY210 pKa = 10.73TKK212 pKa = 10.22TADD215 pKa = 3.62NTWEE219 pKa = 3.85VSVYY223 pKa = 10.43NQADD227 pKa = 3.35ATAGGFPYY235 pKa = 10.58SSGALATEE243 pKa = 4.18TLTFDD248 pKa = 3.28STTYY252 pKa = 11.53ALTSPTSLSIPVPNGSTVVLDD273 pKa = 3.66ISKK276 pKa = 8.49STQLDD281 pKa = 3.16AKK283 pKa = 9.09YY284 pKa = 9.08TFSANVNGNAASAVKK299 pKa = 10.26SVEE302 pKa = 3.71ISDD305 pKa = 5.08DD306 pKa = 3.49GTLSVVYY313 pKa = 10.22EE314 pKa = 4.7DD315 pKa = 4.41GSSVAAYY322 pKa = 7.37TIPLAMVASPDD333 pKa = 3.3NMTVISGNAYY343 pKa = 10.44LPNQDD348 pKa = 3.93SGSVQIGTAGTNGFGTIGSYY368 pKa = 7.58TLEE371 pKa = 4.27NSDD374 pKa = 3.26VDD376 pKa = 4.22LATEE380 pKa = 4.69LTRR383 pKa = 11.84MIQSQNIYY391 pKa = 10.11QSNAKK396 pKa = 9.48VFQTGSDD403 pKa = 3.65LLKK406 pKa = 11.1VLVNLNTT413 pKa = 3.59
MM1 pKa = 7.44SLYY4 pKa = 11.17GLLNTSASGMAAQSTALSTVADD26 pKa = 4.39NIANVSTTGYY36 pKa = 9.96KK37 pKa = 9.87RR38 pKa = 11.84ASTEE42 pKa = 3.46FSTLVASSGAGNYY55 pKa = 7.93QSGGVDD61 pKa = 2.66VDD63 pKa = 3.57TRR65 pKa = 11.84VAIGSQSGTTSTSSSTDD82 pKa = 3.3LAVDD86 pKa = 3.69GNGFFIVSGPNGTPALTRR104 pKa = 11.84AGSFEE109 pKa = 3.99KK110 pKa = 10.71QADD113 pKa = 3.98GTLEE117 pKa = 3.86NAAGYY122 pKa = 7.45TLLGYY127 pKa = 9.4PVGTTPSANSYY138 pKa = 11.12AGLEE142 pKa = 4.12EE143 pKa = 4.69VNISDD148 pKa = 4.64LAMKK152 pKa = 9.94AVPSTEE158 pKa = 3.79GTVTFNLPLQATAVTDD174 pKa = 3.72ATKK177 pKa = 10.79LPSANAADD185 pKa = 3.45ATYY188 pKa = 8.83TQKK191 pKa = 9.9TSFTAYY197 pKa = 10.17NNAGTAVNLDD207 pKa = 3.12AYY209 pKa = 8.04YY210 pKa = 10.73TKK212 pKa = 10.22TADD215 pKa = 3.62NTWEE219 pKa = 3.85VSVYY223 pKa = 10.43NQADD227 pKa = 3.35ATAGGFPYY235 pKa = 10.58SSGALATEE243 pKa = 4.18TLTFDD248 pKa = 3.28STTYY252 pKa = 11.53ALTSPTSLSIPVPNGSTVVLDD273 pKa = 3.66ISKK276 pKa = 8.49STQLDD281 pKa = 3.16AKK283 pKa = 9.09YY284 pKa = 9.08TFSANVNGNAASAVKK299 pKa = 10.26SVEE302 pKa = 3.71ISDD305 pKa = 5.08DD306 pKa = 3.49GTLSVVYY313 pKa = 10.22EE314 pKa = 4.7DD315 pKa = 4.41GSSVAAYY322 pKa = 7.37TIPLAMVASPDD333 pKa = 3.3NMTVISGNAYY343 pKa = 10.44LPNQDD348 pKa = 3.93SGSVQIGTAGTNGFGTIGSYY368 pKa = 7.58TLEE371 pKa = 4.27NSDD374 pKa = 3.26VDD376 pKa = 4.22LATEE380 pKa = 4.69LTRR383 pKa = 11.84MIQSQNIYY391 pKa = 10.11QSNAKK396 pKa = 9.48VFQTGSDD403 pKa = 3.65LLKK406 pKa = 11.1VLVNLNTT413 pKa = 3.59
Molecular weight: 42.25 kDa
Isoelectric point according different methods:
Protein with the highest isoelectric point:
>tr|E3I8I3|E3I8I3_RHOVT Death-on-curing family protein OS=Rhodomicrobium vannielii (strain ATCC 17100 / ATH 3.1.1 / DSM 162 / LMG 4299) OX=648757 GN=Rvan_1642 PE=4 SV=1
MM1 pKa = 7.62TKK3 pKa = 9.12RR4 pKa = 11.84TYY6 pKa = 10.35QPSNLRR12 pKa = 11.84RR13 pKa = 11.84KK14 pKa = 9.25RR15 pKa = 11.84KK16 pKa = 8.64HH17 pKa = 4.95GFRR20 pKa = 11.84ARR22 pKa = 11.84MSTKK26 pKa = 9.78QGRR29 pKa = 11.84TVLSRR34 pKa = 11.84RR35 pKa = 11.84RR36 pKa = 11.84ARR38 pKa = 11.84GRR40 pKa = 11.84TKK42 pKa = 10.84LSAA45 pKa = 3.69
MM1 pKa = 7.62TKK3 pKa = 9.12RR4 pKa = 11.84TYY6 pKa = 10.35QPSNLRR12 pKa = 11.84RR13 pKa = 11.84KK14 pKa = 9.25RR15 pKa = 11.84KK16 pKa = 8.64HH17 pKa = 4.95GFRR20 pKa = 11.84ARR22 pKa = 11.84MSTKK26 pKa = 9.78QGRR29 pKa = 11.84TVLSRR34 pKa = 11.84RR35 pKa = 11.84RR36 pKa = 11.84ARR38 pKa = 11.84GRR40 pKa = 11.84TKK42 pKa = 10.84LSAA45 pKa = 3.69
Molecular weight: 5.39 kDa
Isoelectric point according different methods:
Peptides (in silico digests for buttom-up proteomics)
Below you can find in silico digests of the whole proteome with Trypsin, Chymotrypsin, Trypsin+LysC, LysN, ArgC proteases suitable for different mass spec machines.| Try ESI |
 |
|---|
| ChTry ESI |
|
|---|
| ArgC ESI |
|
|---|
| LysN ESI |
|
|---|
| TryLysC ESI |
|
|---|
| Try MALDI |
|
|---|
| ChTry MALDI |
|
|---|
| ArgC MALDI |
|
|---|
| LysN MALDI |
|
|---|
| TryLysC MALDI |
|
|---|
| Try LTQ |
|
|---|
| ChTry LTQ |
|
|---|
| ArgC LTQ |
|
|---|
| LysN LTQ |
|
|---|
| TryLysC LTQ |
|
|---|
| Try MSlow |
|
|---|
| ChTry MSlow |
|
|---|
| ArgC MSlow |
|
|---|
| LysN MSlow |
|
|---|
| TryLysC MSlow |
|
|---|
| Try MShigh |
|
|---|
| ChTry MShigh |
|
|---|
| ArgC MShigh |
|
|---|
| LysN MShigh |
|
|---|
| TryLysC MShigh |
|
|---|
General Statistics
Number of major isoforms |
Number of additional isoforms |
Number of all proteins |
Number of amino acids |
Min. Seq. Length |
Max. Seq. Length |
Avg. Seq. Length |
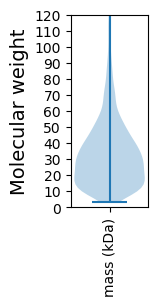
Avg. Mol. Weight |
|---|---|---|---|---|---|---|---|
0 |
1117615 |
30 |
1994 |
318.1 |
34.59 |
Amino acid frequency
Ala |
Cys |
Asp |
Glu |
Phe |
Gly |
His |
Ile |
Lys |
Leu |
|---|---|---|---|---|---|---|---|---|---|
12.731 ± 0.066 | 0.888 ± 0.015 |
5.536 ± 0.03 | 6.001 ± 0.038 |
3.894 ± 0.027 | 8.176 ± 0.044 |
1.993 ± 0.023 | 5.196 ± 0.031 |
3.945 ± 0.034 | 9.912 ± 0.049 |
Met |
Asn |
Gln |
Pro |
Arg |
Ser |
Thr |
Val |
Trp |
Tyr |
|---|---|---|---|---|---|---|---|---|---|
2.143 ± 0.016 | 2.67 ± 0.027 |
5.212 ± 0.033 | 3.013 ± 0.027 |
7.171 ± 0.043 | 5.609 ± 0.032 |
5.162 ± 0.031 | 7.181 ± 0.032 |
1.253 ± 0.017 | 2.316 ± 0.023 |
Most of the basic statistics you can see at this page can be downloaded from this CSV file
See this proteome in:

Proteome-pI is available under Creative Commons Attribution-NoDerivs license, for more details see here
| Reference: Kozlowski LP. Proteome-pI 2.0: Proteome Isoelectric Point Database Update. Nucleic Acids Res. 2021, doi: 10.1093/nar/gkab944 | Contact: Lukasz P. Kozlowski |