Streptococcus phage Javan112
Taxonomy: Viruses; Duplodnaviria; Heunggongvirae; Uroviricota; Caudoviricetes; Caudovirales; Siphoviridae; unclassified Siphoviridae
Average proteome isoelectric point is 6.11
Get precalculated fractions of proteins
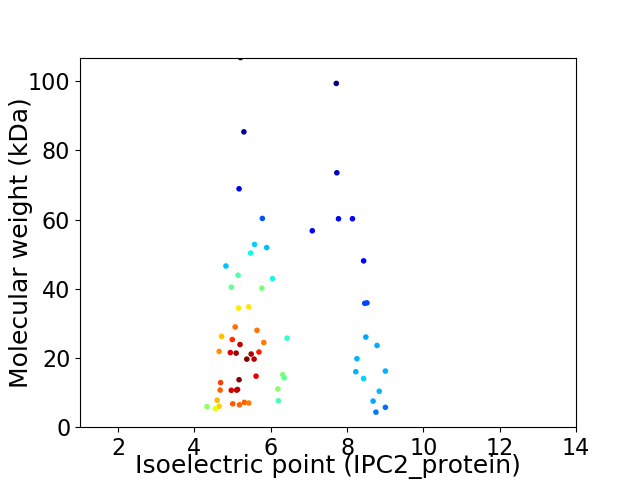
Virtual 2D-PAGE plot for 65 proteins (isoelectric point calculated using IPC2_protein)
Get csv file with sequences according to given criteria:
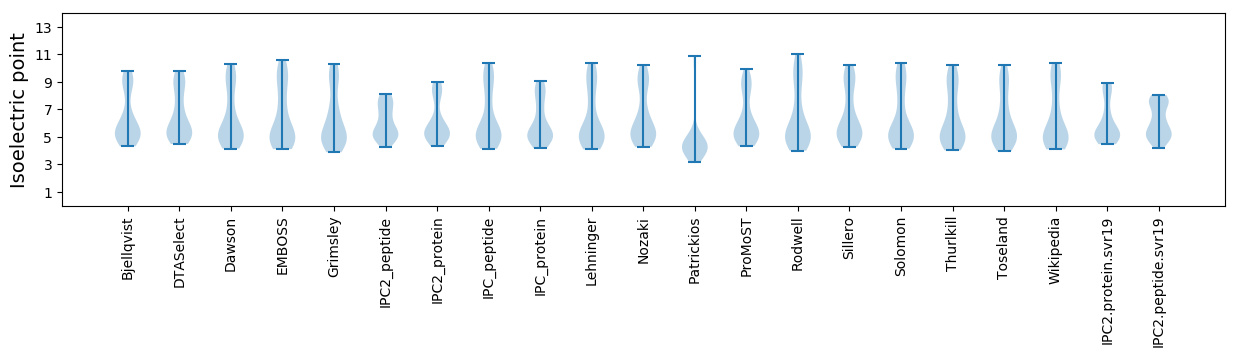
* You can choose from 21 different methods for calculating isoelectric point
Summary statistics related to proteome-wise predictions
Protein with the lowest isoelectric point:
>tr|A0A4D6ANY8|A0A4D6ANY8_9CAUD VRR-NUC domain-containing protein OS=Streptococcus phage Javan112 OX=2547982 GN=Javan112_0039 PE=4 SV=1
MM1 pKa = 7.48EE2 pKa = 5.54LVLMADD8 pKa = 3.51IQAPPVGTKK17 pKa = 9.05GTVRR21 pKa = 11.84GVDD24 pKa = 3.87DD25 pKa = 4.31IGSIMVSWDD34 pKa = 3.29NGSSLSVAYY43 pKa = 10.36GEE45 pKa = 4.3DD46 pKa = 3.23FCRR49 pKa = 11.84RR50 pKa = 11.84ISDD53 pKa = 3.44EE54 pKa = 3.96RR55 pKa = 4.42
MM1 pKa = 7.48EE2 pKa = 5.54LVLMADD8 pKa = 3.51IQAPPVGTKK17 pKa = 9.05GTVRR21 pKa = 11.84GVDD24 pKa = 3.87DD25 pKa = 4.31IGSIMVSWDD34 pKa = 3.29NGSSLSVAYY43 pKa = 10.36GEE45 pKa = 4.3DD46 pKa = 3.23FCRR49 pKa = 11.84RR50 pKa = 11.84ISDD53 pKa = 3.44EE54 pKa = 3.96RR55 pKa = 4.42
Molecular weight: 5.95 kDa
Isoelectric point according different methods:
Protein with the highest isoelectric point:
>tr|A0A4D6APU3|A0A4D6APU3_9CAUD Uncharacterized protein OS=Streptococcus phage Javan112 OX=2547982 GN=Javan112_0015 PE=4 SV=1
MM1 pKa = 7.64VSLKK5 pKa = 9.96QKK7 pKa = 10.35KK8 pKa = 9.18IRR10 pKa = 11.84EE11 pKa = 3.38IWAFVNFAGSQFLSLLEE28 pKa = 3.95EE29 pKa = 4.15RR30 pKa = 11.84KK31 pKa = 9.84KK32 pKa = 10.99DD33 pKa = 3.42SAQIAVEE40 pKa = 4.3TNGGIAIWMRR50 pKa = 3.49
MM1 pKa = 7.64VSLKK5 pKa = 9.96QKK7 pKa = 10.35KK8 pKa = 9.18IRR10 pKa = 11.84EE11 pKa = 3.38IWAFVNFAGSQFLSLLEE28 pKa = 3.95EE29 pKa = 4.15RR30 pKa = 11.84KK31 pKa = 9.84KK32 pKa = 10.99DD33 pKa = 3.42SAQIAVEE40 pKa = 4.3TNGGIAIWMRR50 pKa = 3.49
Molecular weight: 5.74 kDa
Isoelectric point according different methods:
Peptides (in silico digests for buttom-up proteomics)
Below you can find in silico digests of the whole proteome with Trypsin, Chymotrypsin, Trypsin+LysC, LysN, ArgC proteases suitable for different mass spec machines.| Try ESI |
 |
|---|
| ChTry ESI |
|
|---|
| ArgC ESI |
|
|---|
| LysN ESI |
|
|---|
| TryLysC ESI |
|
|---|
| Try MALDI |
|
|---|
| ChTry MALDI |
|
|---|
| ArgC MALDI |
|
|---|
| LysN MALDI |
|
|---|
| TryLysC MALDI |
|
|---|
| Try LTQ |
|
|---|
| ChTry LTQ |
|
|---|
| ArgC LTQ |
|
|---|
| LysN LTQ |
|
|---|
| TryLysC LTQ |
|
|---|
| Try MSlow |
|
|---|
| ChTry MSlow |
|
|---|
| ArgC MSlow |
|
|---|
| LysN MSlow |
|
|---|
| TryLysC MSlow |
|
|---|
| Try MShigh |
|
|---|
| ChTry MShigh |
|
|---|
| ArgC MShigh |
|
|---|
| LysN MShigh |
|
|---|
| TryLysC MShigh |
|
|---|
General Statistics
Number of major isoforms |
Number of additional isoforms |
Number of all proteins |
Number of amino acids |
Min. Seq. Length |
Max. Seq. Length |
Avg. Seq. Length |
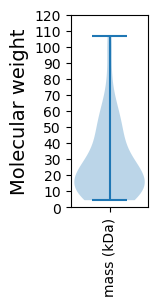
Avg. Mol. Weight |
|---|---|---|---|---|---|---|---|
0 |
16620 |
38 |
941 |
255.7 |
29.05 |
Amino acid frequency
Ala |
Cys |
Asp |
Glu |
Phe |
Gly |
His |
Ile |
Lys |
Leu |
|---|---|---|---|---|---|---|---|---|---|
6.197 ± 0.305 | 1.161 ± 0.112 |
6.173 ± 0.218 | 8.171 ± 0.319 |
3.989 ± 0.192 | 6.252 ± 0.282 |
1.582 ± 0.099 | 8.026 ± 0.254 |
8.941 ± 0.299 | 8.345 ± 0.21 |
Met |
Asn |
Gln |
Pro |
Arg |
Ser |
Thr |
Val |
Trp |
Tyr |
|---|---|---|---|---|---|---|---|---|---|
2.641 ± 0.128 | 5.523 ± 0.222 |
2.972 ± 0.188 | 2.948 ± 0.159 |
4.236 ± 0.254 | 6.528 ± 0.313 |
5.168 ± 0.204 | 5.824 ± 0.182 |
1.167 ± 0.076 | 4.152 ± 0.28 |
Most of the basic statistics you can see at this page can be downloaded from this CSV file
See this proteome in:

Proteome-pI is available under Creative Commons Attribution-NoDerivs license, for more details see here
| Reference: Kozlowski LP. Proteome-pI 2.0: Proteome Isoelectric Point Database Update. Nucleic Acids Res. 2021, doi: 10.1093/nar/gkab944 | Contact: Lukasz P. Kozlowski |