Paenibacillus sp. N3.4
Taxonomy: cellular organisms; Bacteria; Terrabacteria group; Firmicutes; Bacilli; Bacillales; Paenibacillaceae; Paenibacillus; unclassified Paenibacillus
Average proteome isoelectric point is 6.47
Get precalculated fractions of proteins
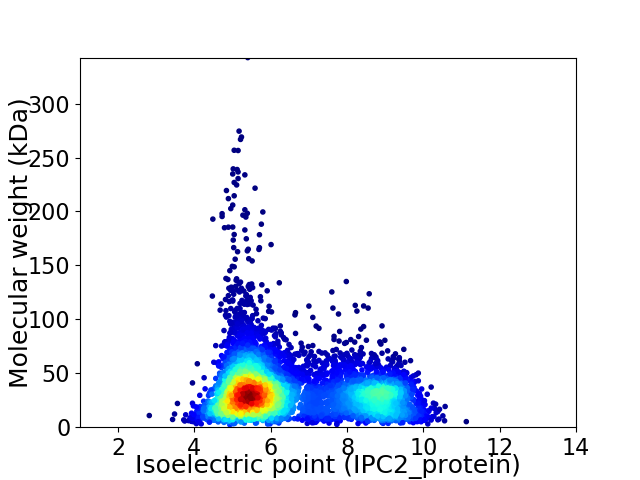
Virtual 2D-PAGE plot for 6173 proteins (isoelectric point calculated using IPC2_protein)
Get csv file with sequences according to given criteria:
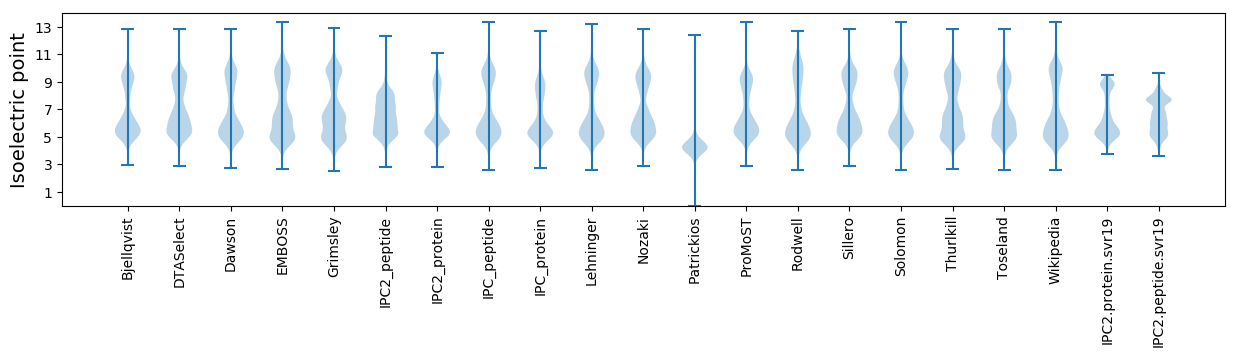
* You can choose from 21 different methods for calculating isoelectric point
Summary statistics related to proteome-wise predictions
Protein with the lowest isoelectric point:
>tr|A0A5C8LFE3|A0A5C8LFE3_9BACL MATE family efflux transporter OS=Paenibacillus sp. N3.4 OX=2603222 GN=FU659_29655 PE=4 SV=1
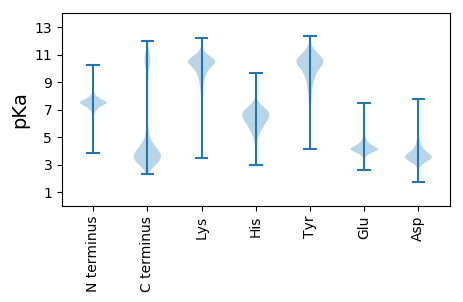
MM1 pKa = 7.27YY2 pKa = 10.81NLVNDD7 pKa = 4.18KK8 pKa = 11.2SGDD11 pKa = 3.9GPIQPYY17 pKa = 10.39DD18 pKa = 3.56SSDD21 pKa = 3.6SVDD24 pKa = 3.95LYY26 pKa = 11.35VISTRR31 pKa = 11.84EE32 pKa = 3.78DD33 pKa = 3.6SNFGQFIFTNAVLCAQDD50 pKa = 3.64IVSKK54 pKa = 10.94SS55 pKa = 3.15
MM1 pKa = 7.27YY2 pKa = 10.81NLVNDD7 pKa = 4.18KK8 pKa = 11.2SGDD11 pKa = 3.9GPIQPYY17 pKa = 10.39DD18 pKa = 3.56SSDD21 pKa = 3.6SVDD24 pKa = 3.95LYY26 pKa = 11.35VISTRR31 pKa = 11.84EE32 pKa = 3.78DD33 pKa = 3.6SNFGQFIFTNAVLCAQDD50 pKa = 3.64IVSKK54 pKa = 10.94SS55 pKa = 3.15
Molecular weight: 6.07 kDa
Isoelectric point according different methods:
Protein with the highest isoelectric point:
>tr|A0A5C8LNE9|A0A5C8LNE9_9BACL Elongation factor G OS=Paenibacillus sp. N3.4 OX=2603222 GN=fusA PE=3 SV=1
MM1 pKa = 7.61GPTFNPNTRR10 pKa = 11.84KK11 pKa = 9.86RR12 pKa = 11.84KK13 pKa = 8.79KK14 pKa = 9.13NHH16 pKa = 5.06GFRR19 pKa = 11.84KK20 pKa = 9.98RR21 pKa = 11.84MSTKK25 pKa = 10.0NGRR28 pKa = 11.84KK29 pKa = 8.8VLQARR34 pKa = 11.84RR35 pKa = 11.84LKK37 pKa = 10.45GRR39 pKa = 11.84KK40 pKa = 8.72ILSAA44 pKa = 4.02
MM1 pKa = 7.61GPTFNPNTRR10 pKa = 11.84KK11 pKa = 9.86RR12 pKa = 11.84KK13 pKa = 8.79KK14 pKa = 9.13NHH16 pKa = 5.06GFRR19 pKa = 11.84KK20 pKa = 9.98RR21 pKa = 11.84MSTKK25 pKa = 10.0NGRR28 pKa = 11.84KK29 pKa = 8.8VLQARR34 pKa = 11.84RR35 pKa = 11.84LKK37 pKa = 10.45GRR39 pKa = 11.84KK40 pKa = 8.72ILSAA44 pKa = 4.02
Molecular weight: 5.17 kDa
Isoelectric point according different methods:
Peptides (in silico digests for buttom-up proteomics)
Below you can find in silico digests of the whole proteome with Trypsin, Chymotrypsin, Trypsin+LysC, LysN, ArgC proteases suitable for different mass spec machines.| Try ESI |
 |
|---|
| ChTry ESI |
|
|---|
| ArgC ESI |
|
|---|
| LysN ESI |
|
|---|
| TryLysC ESI |
|
|---|
| Try MALDI |
|
|---|
| ChTry MALDI |
|
|---|
| ArgC MALDI |
|
|---|
| LysN MALDI |
|
|---|
| TryLysC MALDI |
|
|---|
| Try LTQ |
|
|---|
| ChTry LTQ |
|
|---|
| ArgC LTQ |
|
|---|
| LysN LTQ |
|
|---|
| TryLysC LTQ |
|
|---|
| Try MSlow |
|
|---|
| ChTry MSlow |
|
|---|
| ArgC MSlow |
|
|---|
| LysN MSlow |
|
|---|
| TryLysC MSlow |
|
|---|
| Try MShigh |
|
|---|
| ChTry MShigh |
|
|---|
| ArgC MShigh |
|
|---|
| LysN MShigh |
|
|---|
| TryLysC MShigh |
|
|---|
General Statistics
Number of major isoforms |
Number of additional isoforms |
Number of all proteins |
Number of amino acids |
Min. Seq. Length |
Max. Seq. Length |
Avg. Seq. Length |
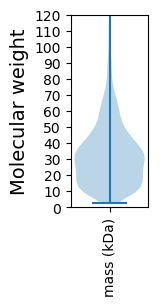
Avg. Mol. Weight |
|---|---|---|---|---|---|---|---|
0 |
1941827 |
21 |
3240 |
314.6 |
35.1 |
Amino acid frequency
Ala |
Cys |
Asp |
Glu |
Phe |
Gly |
His |
Ile |
Lys |
Leu |
|---|---|---|---|---|---|---|---|---|---|
7.748 ± 0.042 | 0.746 ± 0.01 |
5.053 ± 0.022 | 6.207 ± 0.042 |
4.261 ± 0.026 | 7.027 ± 0.035 |
2.139 ± 0.018 | 7.203 ± 0.038 |
5.822 ± 0.031 | 10.006 ± 0.046 |
Met |
Asn |
Gln |
Pro |
Arg |
Ser |
Thr |
Val |
Trp |
Tyr |
|---|---|---|---|---|---|---|---|---|---|
2.813 ± 0.017 | 4.245 ± 0.03 |
3.832 ± 0.02 | 4.076 ± 0.023 |
4.403 ± 0.03 | 6.705 ± 0.029 |
5.822 ± 0.036 | 7.065 ± 0.026 |
1.28 ± 0.013 | 3.55 ± 0.02 |
Most of the basic statistics you can see at this page can be downloaded from this CSV file
See this proteome in:

Proteome-pI is available under Creative Commons Attribution-NoDerivs license, for more details see here
| Reference: Kozlowski LP. Proteome-pI 2.0: Proteome Isoelectric Point Database Update. Nucleic Acids Res. 2021, doi: 10.1093/nar/gkab944 | Contact: Lukasz P. Kozlowski |