Pseudomonas phage MR1
Taxonomy: Viruses; Duplodnaviria; Heunggongvirae; Uroviricota; Caudoviricetes; Caudovirales; Autographiviridae; Studiervirinae; Ghunavirus; unclassified Ghunavirus
Average proteome isoelectric point is 6.61
Get precalculated fractions of proteins
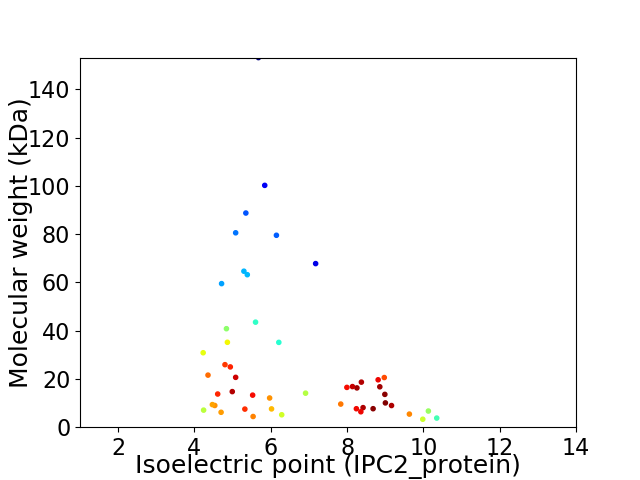
Virtual 2D-PAGE plot for 50 proteins (isoelectric point calculated using IPC2_protein)
Get csv file with sequences according to given criteria:
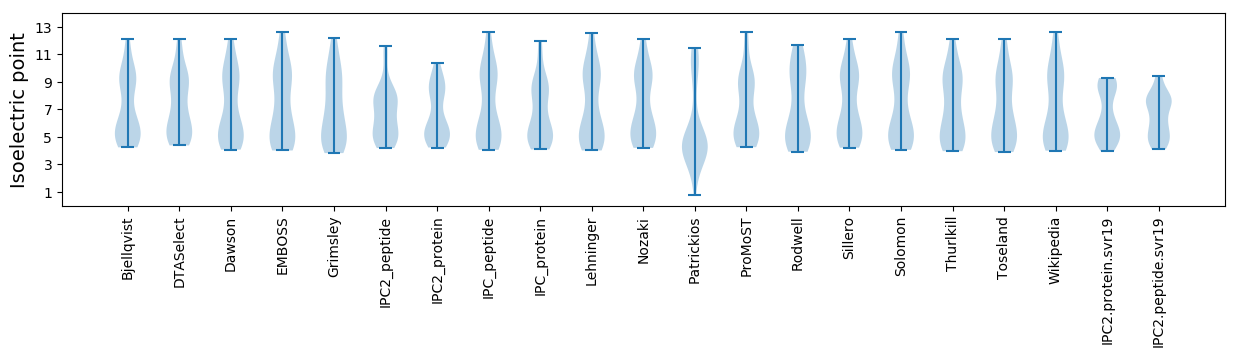
* You can choose from 21 different methods for calculating isoelectric point
Summary statistics related to proteome-wise predictions
Protein with the lowest isoelectric point:
>tr|A0A6M3T8H4|A0A6M3T8H4_9CAUD Uncharacterized protein OS=Pseudomonas phage MR1 OX=2711169 GN=PssvBMR1_gp13 PE=4 SV=1
MM1 pKa = 5.9VTAMGLNRR9 pKa = 11.84EE10 pKa = 4.22QKK12 pKa = 10.46DD13 pKa = 2.94WAAQHH18 pKa = 6.18DD19 pKa = 4.53WYY21 pKa = 11.13RR22 pKa = 11.84EE23 pKa = 4.18CFVNAYY29 pKa = 10.17NLYY32 pKa = 8.89TVMVYY37 pKa = 10.51DD38 pKa = 4.75SEE40 pKa = 5.4LDD42 pKa = 3.6DD43 pKa = 5.06VIPMTDD49 pKa = 3.76FNEE52 pKa = 3.81LRR54 pKa = 11.84SWAGYY59 pKa = 9.65
MM1 pKa = 5.9VTAMGLNRR9 pKa = 11.84EE10 pKa = 4.22QKK12 pKa = 10.46DD13 pKa = 2.94WAAQHH18 pKa = 6.18DD19 pKa = 4.53WYY21 pKa = 11.13RR22 pKa = 11.84EE23 pKa = 4.18CFVNAYY29 pKa = 10.17NLYY32 pKa = 8.89TVMVYY37 pKa = 10.51DD38 pKa = 4.75SEE40 pKa = 5.4LDD42 pKa = 3.6DD43 pKa = 5.06VIPMTDD49 pKa = 3.76FNEE52 pKa = 3.81LRR54 pKa = 11.84SWAGYY59 pKa = 9.65
Molecular weight: 7.07 kDa
Isoelectric point according different methods:
Protein with the highest isoelectric point:
>tr|A0A6M3TA20|A0A6M3TA20_9CAUD Putative single-stranded DNA-binding protein OS=Pseudomonas phage MR1 OX=2711169 GN=PssvBMR1_gp16 PE=4 SV=1
MM1 pKa = 7.46FARR4 pKa = 11.84NFEE7 pKa = 4.14KK8 pKa = 8.7TTRR11 pKa = 11.84TNARR15 pKa = 11.84RR16 pKa = 11.84SFEE19 pKa = 4.04EE20 pKa = 4.14VEE22 pKa = 3.81QARR25 pKa = 11.84AKK27 pKa = 10.2KK28 pKa = 10.43GKK30 pKa = 9.22SNKK33 pKa = 9.11PNRR36 pKa = 11.84TQRR39 pKa = 11.84TEE41 pKa = 3.34WEE43 pKa = 4.4TNN45 pKa = 3.11
MM1 pKa = 7.46FARR4 pKa = 11.84NFEE7 pKa = 4.14KK8 pKa = 8.7TTRR11 pKa = 11.84TNARR15 pKa = 11.84RR16 pKa = 11.84SFEE19 pKa = 4.04EE20 pKa = 4.14VEE22 pKa = 3.81QARR25 pKa = 11.84AKK27 pKa = 10.2KK28 pKa = 10.43GKK30 pKa = 9.22SNKK33 pKa = 9.11PNRR36 pKa = 11.84TQRR39 pKa = 11.84TEE41 pKa = 3.34WEE43 pKa = 4.4TNN45 pKa = 3.11
Molecular weight: 5.43 kDa
Isoelectric point according different methods:
Peptides (in silico digests for buttom-up proteomics)
Below you can find in silico digests of the whole proteome with Trypsin, Chymotrypsin, Trypsin+LysC, LysN, ArgC proteases suitable for different mass spec machines.| Try ESI |
 |
|---|
| ChTry ESI |
|
|---|
| ArgC ESI |
|
|---|
| LysN ESI |
|
|---|
| TryLysC ESI |
|
|---|
| Try MALDI |
|
|---|
| ChTry MALDI |
|
|---|
| ArgC MALDI |
|
|---|
| LysN MALDI |
|
|---|
| TryLysC MALDI |
|
|---|
| Try LTQ |
|
|---|
| ChTry LTQ |
|
|---|
| ArgC LTQ |
|
|---|
| LysN LTQ |
|
|---|
| TryLysC LTQ |
|
|---|
| Try MSlow |
|
|---|
| ChTry MSlow |
|
|---|
| ArgC MSlow |
|
|---|
| LysN MSlow |
|
|---|
| TryLysC MSlow |
|
|---|
| Try MShigh |
|
|---|
| ChTry MShigh |
|
|---|
| ArgC MShigh |
|
|---|
| LysN MShigh |
|
|---|
| TryLysC MShigh |
|
|---|
General Statistics
Number of major isoforms |
Number of additional isoforms |
Number of all proteins |
Number of amino acids |
Min. Seq. Length |
Max. Seq. Length |
Avg. Seq. Length |
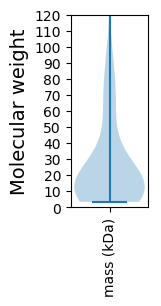
Avg. Mol. Weight |
|---|---|---|---|---|---|---|---|
0 |
12442 |
30 |
1399 |
248.8 |
27.53 |
Amino acid frequency
Ala |
Cys |
Asp |
Glu |
Phe |
Gly |
His |
Ile |
Lys |
Leu |
|---|---|---|---|---|---|---|---|---|---|
9.749 ± 0.472 | 0.892 ± 0.145 |
6.454 ± 0.266 | 6.382 ± 0.33 |
3.561 ± 0.187 | 7.997 ± 0.275 |
1.841 ± 0.176 | 4.822 ± 0.187 |
5.578 ± 0.291 | 7.957 ± 0.331 |
Met |
Asn |
Gln |
Pro |
Arg |
Ser |
Thr |
Val |
Trp |
Tyr |
|---|---|---|---|---|---|---|---|---|---|
2.934 ± 0.125 | 4.372 ± 0.26 |
3.922 ± 0.221 | 4.445 ± 0.322 |
5.875 ± 0.221 | 6.301 ± 0.368 |
5.859 ± 0.251 | 6.566 ± 0.29 |
1.463 ± 0.14 | 3.03 ± 0.142 |
Most of the basic statistics you can see at this page can be downloaded from this CSV file
See this proteome in:

Proteome-pI is available under Creative Commons Attribution-NoDerivs license, for more details see here
| Reference: Kozlowski LP. Proteome-pI 2.0: Proteome Isoelectric Point Database Update. Nucleic Acids Res. 2021, doi: 10.1093/nar/gkab944 | Contact: Lukasz P. Kozlowski |