Salmonella phage SE21
Taxonomy: Viruses; Duplodnaviria; Heunggongvirae; Uroviricota; Caudoviricetes; Caudovirales; Podoviridae; Lederbergvirus; unclassified Lederbergvirus
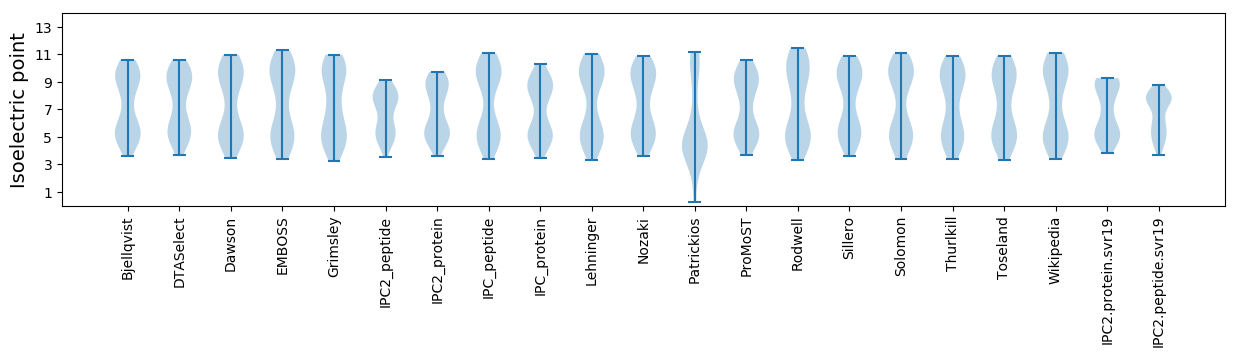
Average proteome isoelectric point is 6.85
Get precalculated fractions of proteins

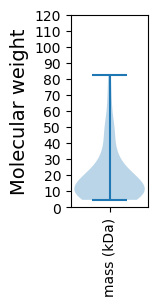
Virtual 2D-PAGE plot for 66 proteins (isoelectric point calculated using IPC2_protein)
Get csv file with sequences according to given criteria:
* You can choose from 21 different methods for calculating isoelectric point
Summary statistics related to proteome-wise predictions
Protein with the lowest isoelectric point:
>tr|A0A5C0CBN8|A0A5C0CBN8_9CAUD CII protein OS=Salmonella phage SE21 OX=2592200 PE=4 SV=1
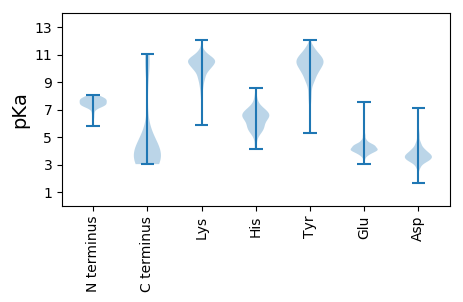
MM1 pKa = 7.71LSPTQIMQYY10 pKa = 9.75QKK12 pKa = 10.94EE13 pKa = 4.53SVDD16 pKa = 4.19RR17 pKa = 11.84ALTCANCGQKK27 pKa = 10.32LHH29 pKa = 5.86VLEE32 pKa = 4.29VHH34 pKa = 5.94VCEE37 pKa = 4.68ACCSEE42 pKa = 5.43LMSDD46 pKa = 4.48PNSAMYY52 pKa = 10.4EE53 pKa = 4.1EE54 pKa = 5.48EE55 pKa = 5.11DD56 pKa = 5.44DD57 pKa = 4.54EE58 pKa = 7.52DD59 pKa = 5.12DD60 pKa = 3.93FAPGKK65 pKa = 10.34EE66 pKa = 4.16DD67 pKa = 3.16
MM1 pKa = 7.71LSPTQIMQYY10 pKa = 9.75QKK12 pKa = 10.94EE13 pKa = 4.53SVDD16 pKa = 4.19RR17 pKa = 11.84ALTCANCGQKK27 pKa = 10.32LHH29 pKa = 5.86VLEE32 pKa = 4.29VHH34 pKa = 5.94VCEE37 pKa = 4.68ACCSEE42 pKa = 5.43LMSDD46 pKa = 4.48PNSAMYY52 pKa = 10.4EE53 pKa = 4.1EE54 pKa = 5.48EE55 pKa = 5.11DD56 pKa = 5.44DD57 pKa = 4.54EE58 pKa = 7.52DD59 pKa = 5.12DD60 pKa = 3.93FAPGKK65 pKa = 10.34EE66 pKa = 4.16DD67 pKa = 3.16
Molecular weight: 7.53 kDa
Isoelectric point according different methods:
Protein with the highest isoelectric point:
>tr|A0A5C0CC01|A0A5C0CC01_9CAUD Protein Kil OS=Salmonella phage SE21 OX=2592200 PE=4 SV=1
MM1 pKa = 7.92IIRR4 pKa = 11.84HH5 pKa = 5.61RR6 pKa = 11.84FKK8 pKa = 10.61PINDD12 pKa = 3.38IPRR15 pKa = 11.84EE16 pKa = 3.78EE17 pKa = 3.91MLARR21 pKa = 11.84KK22 pKa = 8.92SFPSVNEE29 pKa = 3.83NKK31 pKa = 10.35YY32 pKa = 10.3LNAMLRR38 pKa = 11.84SGKK41 pKa = 9.99KK42 pKa = 9.6
MM1 pKa = 7.92IIRR4 pKa = 11.84HH5 pKa = 5.61RR6 pKa = 11.84FKK8 pKa = 10.61PINDD12 pKa = 3.38IPRR15 pKa = 11.84EE16 pKa = 3.78EE17 pKa = 3.91MLARR21 pKa = 11.84KK22 pKa = 8.92SFPSVNEE29 pKa = 3.83NKK31 pKa = 10.35YY32 pKa = 10.3LNAMLRR38 pKa = 11.84SGKK41 pKa = 9.99KK42 pKa = 9.6
Molecular weight: 5.03 kDa
Isoelectric point according different methods:
Peptides (in silico digests for buttom-up proteomics)
Below you can find in silico digests of the whole proteome with Trypsin, Chymotrypsin, Trypsin+LysC, LysN, ArgC proteases suitable for different mass spec machines.| Try ESI |
 |
|---|
| ChTry ESI |
|
|---|
| ArgC ESI |
|
|---|
| LysN ESI |
|
|---|
| TryLysC ESI |
|
|---|
| Try MALDI |
|
|---|
| ChTry MALDI |
|
|---|
| ArgC MALDI |
|
|---|
| LysN MALDI |
|
|---|
| TryLysC MALDI |
|
|---|
| Try LTQ |
|
|---|
| ChTry LTQ |
|
|---|
| ArgC LTQ |
|
|---|
| LysN LTQ |
|
|---|
| TryLysC LTQ |
|
|---|
| Try MSlow |
|
|---|
| ChTry MSlow |
|
|---|
| ArgC MSlow |
|
|---|
| LysN MSlow |
|
|---|
| TryLysC MSlow |
|
|---|
| Try MShigh |
|
|---|
| ChTry MShigh |
|
|---|
| ArgC MShigh |
|
|---|
| LysN MShigh |
|
|---|
| TryLysC MShigh |
|
|---|
General Statistics
Number of major isoforms |
Number of additional isoforms |
Number of all proteins |
Number of amino acids |
Min. Seq. Length |
Max. Seq. Length |
Avg. Seq. Length |
Avg. Mol. Weight |
|---|---|---|---|---|---|---|---|
0 |
11820 |
41 |
725 |
179.1 |
20.17 |
Amino acid frequency
Ala |
Cys |
Asp |
Glu |
Phe |
Gly |
His |
Ile |
Lys |
Leu |
|---|---|---|---|---|---|---|---|---|---|
8.756 ± 0.445 | 1.227 ± 0.139 |
6.1 ± 0.235 | 6.946 ± 0.352 |
3.511 ± 0.236 | 6.633 ± 0.378 |
1.76 ± 0.165 | 6.286 ± 0.366 |
6.836 ± 0.302 | 8.003 ± 0.223 |
Met |
Asn |
Gln |
Pro |
Arg |
Ser |
Thr |
Val |
Trp |
Tyr |
|---|---|---|---|---|---|---|---|---|---|
2.995 ± 0.164 | 4.679 ± 0.217 |
3.917 ± 0.187 | 4.019 ± 0.321 |
5.998 ± 0.299 | 6.21 ± 0.259 |
5.0 ± 0.286 | 6.007 ± 0.246 |
1.726 ± 0.154 | 3.393 ± 0.206 |
Most of the basic statistics you can see at this page can be downloaded from this CSV file
See this proteome in:

Proteome-pI is available under Creative Commons Attribution-NoDerivs license, for more details see here
| Reference: Kozlowski LP. Proteome-pI 2.0: Proteome Isoelectric Point Database Update. Nucleic Acids Res. 2021, doi: 10.1093/nar/gkab944 | Contact: Lukasz P. Kozlowski |