Blautia obeum
Taxonomy: cellular organisms; Bacteria; Terrabacteria group; Firmicutes; Clostridia; Eubacteriales; Lachnospiraceae; Blautia
Average proteome isoelectric point is 6.07
Get precalculated fractions of proteins
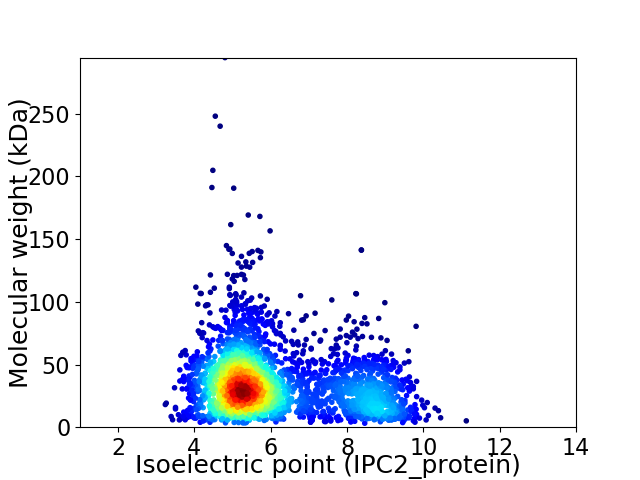
Virtual 2D-PAGE plot for 3072 proteins (isoelectric point calculated using IPC2_protein)
Get csv file with sequences according to given criteria:
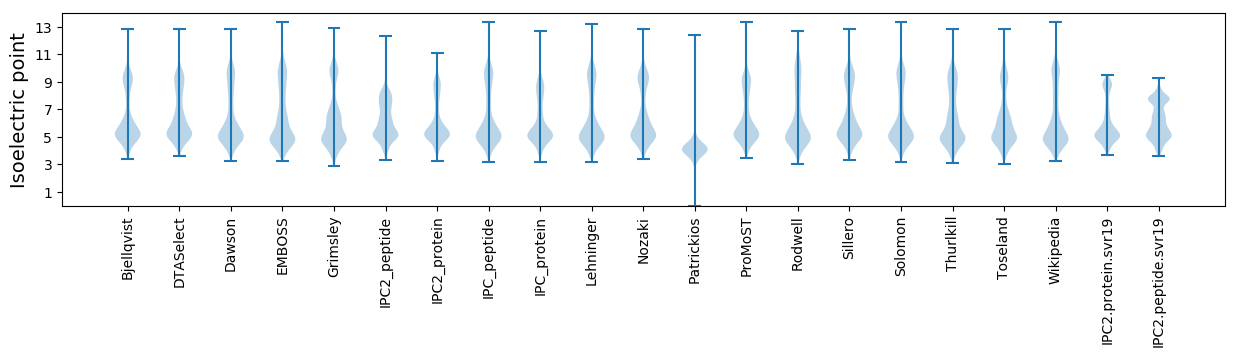
* You can choose from 21 different methods for calculating isoelectric point
Summary statistics related to proteome-wise predictions
Protein with the lowest isoelectric point:
>tr|A0A173ZKG0|A0A173ZKG0_9FIRM D-ribose-binding periplasmic protein OS=Blautia obeum OX=40520 GN=rbsB_3 PE=4 SV=1
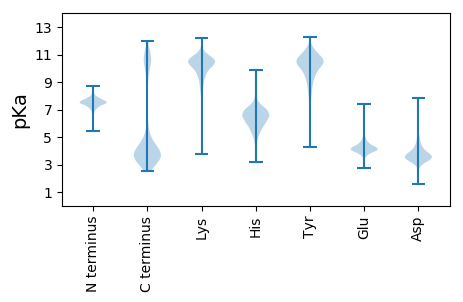
MM1 pKa = 7.24NFKK4 pKa = 10.47KK5 pKa = 10.65VVALSICAAMVAGMSASTVMAADD28 pKa = 4.94LPDD31 pKa = 3.31QFKK34 pKa = 10.95DD35 pKa = 3.62LKK37 pKa = 11.23ANEE40 pKa = 4.36AYY42 pKa = 8.75EE43 pKa = 4.29FPMMVKK49 pKa = 10.25SFQSTYY55 pKa = 9.19WDD57 pKa = 3.55AAQEE61 pKa = 4.29GMKK64 pKa = 10.24KK65 pKa = 10.02AAEE68 pKa = 4.15EE69 pKa = 4.14LGVTYY74 pKa = 8.78TAQGPNSEE82 pKa = 4.82SDD84 pKa = 2.96IADD87 pKa = 3.4QVNMINTAIASNPKK101 pKa = 10.27GLGLAACDD109 pKa = 3.57TSSVLDD115 pKa = 4.0ALNDD119 pKa = 4.03CVSKK123 pKa = 10.9GIPVVTFDD131 pKa = 4.4TGIADD136 pKa = 3.76APEE139 pKa = 4.01GSIACEE145 pKa = 3.94VCTDD149 pKa = 3.36NAQAGSVAAEE159 pKa = 3.86NMYY162 pKa = 10.78NAIKK166 pKa = 10.63DD167 pKa = 3.65VVANAEE173 pKa = 4.12GQVVIGEE180 pKa = 4.33VNQDD184 pKa = 2.58ATAQNIQQRR193 pKa = 11.84GGGFIDD199 pKa = 5.05KK200 pKa = 9.99MIEE203 pKa = 3.71LLQADD208 pKa = 4.71GKK210 pKa = 8.48TVAVAGNEE218 pKa = 4.32FYY220 pKa = 11.79VNAAKK225 pKa = 10.67NADD228 pKa = 3.64ATEE231 pKa = 4.09ADD233 pKa = 3.84ADD235 pKa = 4.04VVIQVAVPAQTTVEE249 pKa = 4.15LCSNEE254 pKa = 3.73AQAILSKK261 pKa = 9.86EE262 pKa = 3.65NCIAIFGSNQTAAEE276 pKa = 4.34GVLAANANLNVLGSDD291 pKa = 3.4AAAGDD296 pKa = 4.03VIGVGFDD303 pKa = 2.86AGSIIKK309 pKa = 10.33AAVQDD314 pKa = 4.17GTFLGAVTQSPLMMGYY330 pKa = 9.54YY331 pKa = 10.51AIYY334 pKa = 10.78ALTAAANGQEE344 pKa = 4.48LEE346 pKa = 4.39DD347 pKa = 4.29VPTDD351 pKa = 4.3GYY353 pKa = 10.72WYY355 pKa = 9.99DD356 pKa = 3.67STNMDD361 pKa = 4.74DD362 pKa = 5.75EE363 pKa = 5.13EE364 pKa = 4.43IAPNLYY370 pKa = 10.36DD371 pKa = 3.33
MM1 pKa = 7.24NFKK4 pKa = 10.47KK5 pKa = 10.65VVALSICAAMVAGMSASTVMAADD28 pKa = 4.94LPDD31 pKa = 3.31QFKK34 pKa = 10.95DD35 pKa = 3.62LKK37 pKa = 11.23ANEE40 pKa = 4.36AYY42 pKa = 8.75EE43 pKa = 4.29FPMMVKK49 pKa = 10.25SFQSTYY55 pKa = 9.19WDD57 pKa = 3.55AAQEE61 pKa = 4.29GMKK64 pKa = 10.24KK65 pKa = 10.02AAEE68 pKa = 4.15EE69 pKa = 4.14LGVTYY74 pKa = 8.78TAQGPNSEE82 pKa = 4.82SDD84 pKa = 2.96IADD87 pKa = 3.4QVNMINTAIASNPKK101 pKa = 10.27GLGLAACDD109 pKa = 3.57TSSVLDD115 pKa = 4.0ALNDD119 pKa = 4.03CVSKK123 pKa = 10.9GIPVVTFDD131 pKa = 4.4TGIADD136 pKa = 3.76APEE139 pKa = 4.01GSIACEE145 pKa = 3.94VCTDD149 pKa = 3.36NAQAGSVAAEE159 pKa = 3.86NMYY162 pKa = 10.78NAIKK166 pKa = 10.63DD167 pKa = 3.65VVANAEE173 pKa = 4.12GQVVIGEE180 pKa = 4.33VNQDD184 pKa = 2.58ATAQNIQQRR193 pKa = 11.84GGGFIDD199 pKa = 5.05KK200 pKa = 9.99MIEE203 pKa = 3.71LLQADD208 pKa = 4.71GKK210 pKa = 8.48TVAVAGNEE218 pKa = 4.32FYY220 pKa = 11.79VNAAKK225 pKa = 10.67NADD228 pKa = 3.64ATEE231 pKa = 4.09ADD233 pKa = 3.84ADD235 pKa = 4.04VVIQVAVPAQTTVEE249 pKa = 4.15LCSNEE254 pKa = 3.73AQAILSKK261 pKa = 9.86EE262 pKa = 3.65NCIAIFGSNQTAAEE276 pKa = 4.34GVLAANANLNVLGSDD291 pKa = 3.4AAAGDD296 pKa = 4.03VIGVGFDD303 pKa = 2.86AGSIIKK309 pKa = 10.33AAVQDD314 pKa = 4.17GTFLGAVTQSPLMMGYY330 pKa = 9.54YY331 pKa = 10.51AIYY334 pKa = 10.78ALTAAANGQEE344 pKa = 4.48LEE346 pKa = 4.39DD347 pKa = 4.29VPTDD351 pKa = 4.3GYY353 pKa = 10.72WYY355 pKa = 9.99DD356 pKa = 3.67STNMDD361 pKa = 4.74DD362 pKa = 5.75EE363 pKa = 5.13EE364 pKa = 4.43IAPNLYY370 pKa = 10.36DD371 pKa = 3.33
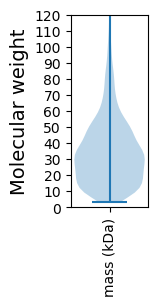
Molecular weight: 38.48 kDa
Isoelectric point according different methods:
Protein with the highest isoelectric point:
>tr|A0A174R7D6|A0A174R7D6_9FIRM Uncharacterized protein OS=Blautia obeum OX=40520 GN=DW021_12595 PE=4 SV=1
MM1 pKa = 7.67KK2 pKa = 8.72MTFQPKK8 pKa = 8.86KK9 pKa = 8.2RR10 pKa = 11.84SRR12 pKa = 11.84AKK14 pKa = 9.27VHH16 pKa = 5.81GFRR19 pKa = 11.84ARR21 pKa = 11.84MSTKK25 pKa = 10.15GGRR28 pKa = 11.84KK29 pKa = 8.69VLAARR34 pKa = 11.84RR35 pKa = 11.84LKK37 pKa = 10.68GRR39 pKa = 11.84KK40 pKa = 8.28QLSAA44 pKa = 3.9
MM1 pKa = 7.67KK2 pKa = 8.72MTFQPKK8 pKa = 8.86KK9 pKa = 8.2RR10 pKa = 11.84SRR12 pKa = 11.84AKK14 pKa = 9.27VHH16 pKa = 5.81GFRR19 pKa = 11.84ARR21 pKa = 11.84MSTKK25 pKa = 10.15GGRR28 pKa = 11.84KK29 pKa = 8.69VLAARR34 pKa = 11.84RR35 pKa = 11.84LKK37 pKa = 10.68GRR39 pKa = 11.84KK40 pKa = 8.28QLSAA44 pKa = 3.9
Molecular weight: 5.06 kDa
Isoelectric point according different methods:
Peptides (in silico digests for buttom-up proteomics)
Below you can find in silico digests of the whole proteome with Trypsin, Chymotrypsin, Trypsin+LysC, LysN, ArgC proteases suitable for different mass spec machines.| Try ESI |
 |
|---|
| ChTry ESI |
|
|---|
| ArgC ESI |
|
|---|
| LysN ESI |
|
|---|
| TryLysC ESI |
|
|---|
| Try MALDI |
|
|---|
| ChTry MALDI |
|
|---|
| ArgC MALDI |
|
|---|
| LysN MALDI |
|
|---|
| TryLysC MALDI |
|
|---|
| Try LTQ |
|
|---|
| ChTry LTQ |
|
|---|
| ArgC LTQ |
|
|---|
| LysN LTQ |
|
|---|
| TryLysC LTQ |
|
|---|
| Try MSlow |
|
|---|
| ChTry MSlow |
|
|---|
| ArgC MSlow |
|
|---|
| LysN MSlow |
|
|---|
| TryLysC MSlow |
|
|---|
| Try MShigh |
|
|---|
| ChTry MShigh |
|
|---|
| ArgC MShigh |
|
|---|
| LysN MShigh |
|
|---|
| TryLysC MShigh |
|
|---|
General Statistics
Number of major isoforms |
Number of additional isoforms |
Number of all proteins |
Number of amino acids |
Min. Seq. Length |
Max. Seq. Length |
Avg. Seq. Length |
Avg. Mol. Weight |
|---|---|---|---|---|---|---|---|
0 |
989712 |
29 |
2594 |
322.2 |
36.18 |
Amino acid frequency
Ala |
Cys |
Asp |
Glu |
Phe |
Gly |
His |
Ile |
Lys |
Leu |
|---|---|---|---|---|---|---|---|---|---|
7.348 ± 0.04 | 1.538 ± 0.021 |
5.753 ± 0.036 | 7.726 ± 0.055 |
4.02 ± 0.035 | 7.024 ± 0.04 |
1.797 ± 0.019 | 7.289 ± 0.041 |
7.066 ± 0.046 | 8.831 ± 0.049 |
Met |
Asn |
Gln |
Pro |
Arg |
Ser |
Thr |
Val |
Trp |
Tyr |
|---|---|---|---|---|---|---|---|---|---|
3.182 ± 0.021 | 4.345 ± 0.03 |
3.256 ± 0.021 | 3.382 ± 0.03 |
4.297 ± 0.039 | 5.726 ± 0.034 |
5.54 ± 0.041 | 6.835 ± 0.036 |
0.927 ± 0.018 | 4.118 ± 0.031 |
Most of the basic statistics you can see at this page can be downloaded from this CSV file
See this proteome in:

Proteome-pI is available under Creative Commons Attribution-NoDerivs license, for more details see here
| Reference: Kozlowski LP. Proteome-pI 2.0: Proteome Isoelectric Point Database Update. Nucleic Acids Res. 2021, doi: 10.1093/nar/gkab944 | Contact: Lukasz P. Kozlowski |