Micromonospora rhizosphaerae
Taxonomy: cellular organisms; Bacteria; Terrabacteria group; Actinobacteria; Actinomycetia; Micromonosporales; Micromonosporaceae; Micromonospora
Average proteome isoelectric point is 6.66
Get precalculated fractions of proteins
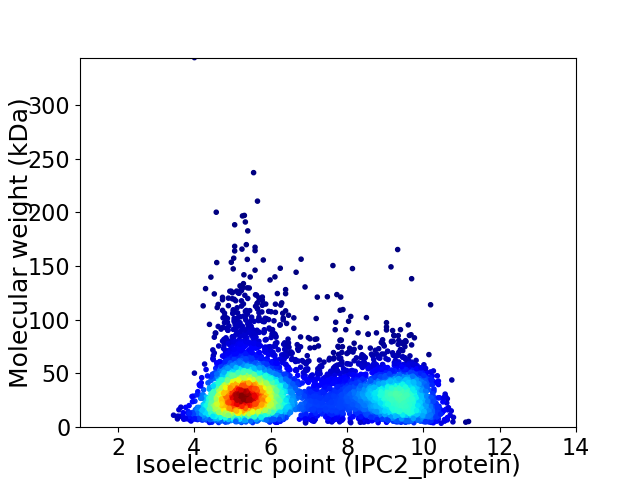
Virtual 2D-PAGE plot for 6395 proteins (isoelectric point calculated using IPC2_protein)
Get csv file with sequences according to given criteria:
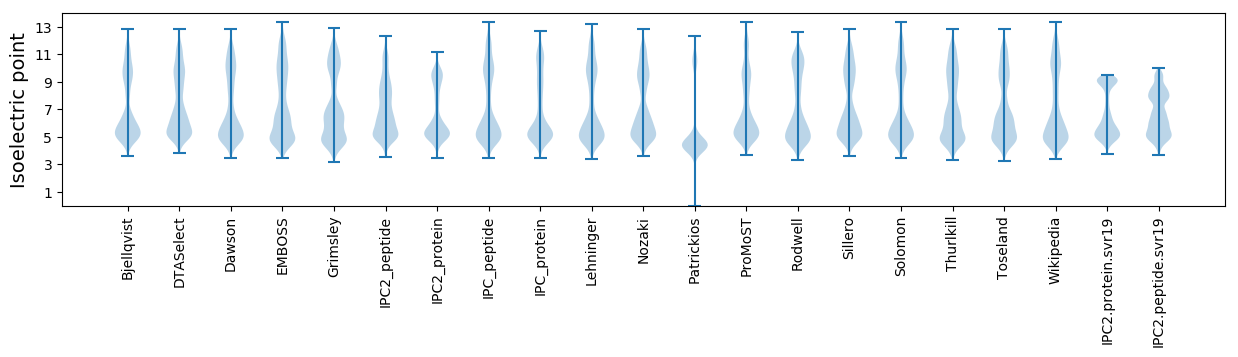
* You can choose from 21 different methods for calculating isoelectric point
Summary statistics related to proteome-wise predictions
Protein with the lowest isoelectric point:
>tr|A0A1C6RN58|A0A1C6RN58_9ACTN 50S ribosomal protein L25 OS=Micromonospora rhizosphaerae OX=568872 GN=rplY PE=3 SV=1
MM1 pKa = 6.87VTTTYY6 pKa = 10.36QVQGMTCGHH15 pKa = 6.54CVNSVSAEE23 pKa = 3.9VGALPGVSDD32 pKa = 3.9VQVDD36 pKa = 4.18LASGRR41 pKa = 11.84VTVTSEE47 pKa = 4.19SPLDD51 pKa = 3.66TDD53 pKa = 3.8TVRR56 pKa = 11.84AAVDD60 pKa = 3.1EE61 pKa = 4.62AGYY64 pKa = 11.0DD65 pKa = 3.52LVGAA69 pKa = 4.97
MM1 pKa = 6.87VTTTYY6 pKa = 10.36QVQGMTCGHH15 pKa = 6.54CVNSVSAEE23 pKa = 3.9VGALPGVSDD32 pKa = 3.9VQVDD36 pKa = 4.18LASGRR41 pKa = 11.84VTVTSEE47 pKa = 4.19SPLDD51 pKa = 3.66TDD53 pKa = 3.8TVRR56 pKa = 11.84AAVDD60 pKa = 3.1EE61 pKa = 4.62AGYY64 pKa = 11.0DD65 pKa = 3.52LVGAA69 pKa = 4.97
Molecular weight: 7.0 kDa
Isoelectric point according different methods:
Protein with the highest isoelectric point:
>tr|A0A1C6S2E1|A0A1C6S2E1_9ACTN Uncharacterized protein OS=Micromonospora rhizosphaerae OX=568872 GN=GA0070624_2764 PE=4 SV=1
MM1 pKa = 7.59KK2 pKa = 10.28VRR4 pKa = 11.84SSLRR8 pKa = 11.84GLKK11 pKa = 10.15RR12 pKa = 11.84KK13 pKa = 8.37MNSMVVRR20 pKa = 11.84RR21 pKa = 11.84RR22 pKa = 11.84GKK24 pKa = 9.95VFVINKK30 pKa = 9.17ANPRR34 pKa = 11.84QKK36 pKa = 10.8ARR38 pKa = 11.84QGG40 pKa = 3.26
MM1 pKa = 7.59KK2 pKa = 10.28VRR4 pKa = 11.84SSLRR8 pKa = 11.84GLKK11 pKa = 10.15RR12 pKa = 11.84KK13 pKa = 8.37MNSMVVRR20 pKa = 11.84RR21 pKa = 11.84RR22 pKa = 11.84GKK24 pKa = 9.95VFVINKK30 pKa = 9.17ANPRR34 pKa = 11.84QKK36 pKa = 10.8ARR38 pKa = 11.84QGG40 pKa = 3.26
Molecular weight: 4.68 kDa
Isoelectric point according different methods:
Peptides (in silico digests for buttom-up proteomics)
Below you can find in silico digests of the whole proteome with Trypsin, Chymotrypsin, Trypsin+LysC, LysN, ArgC proteases suitable for different mass spec machines.| Try ESI |
 |
|---|
| ChTry ESI |
|
|---|
| ArgC ESI |
|
|---|
| LysN ESI |
|
|---|
| TryLysC ESI |
|
|---|
| Try MALDI |
|
|---|
| ChTry MALDI |
|
|---|
| ArgC MALDI |
|
|---|
| LysN MALDI |
|
|---|
| TryLysC MALDI |
|
|---|
| Try LTQ |
|
|---|
| ChTry LTQ |
|
|---|
| ArgC LTQ |
|
|---|
| LysN LTQ |
|
|---|
| TryLysC LTQ |
|
|---|
| Try MSlow |
|
|---|
| ChTry MSlow |
|
|---|
| ArgC MSlow |
|
|---|
| LysN MSlow |
|
|---|
| TryLysC MSlow |
|
|---|
| Try MShigh |
|
|---|
| ChTry MShigh |
|
|---|
| ArgC MShigh |
|
|---|
| LysN MShigh |
|
|---|
| TryLysC MShigh |
|
|---|
General Statistics
Number of major isoforms |
Number of additional isoforms |
Number of all proteins |
Number of amino acids |
Min. Seq. Length |
Max. Seq. Length |
Avg. Seq. Length |
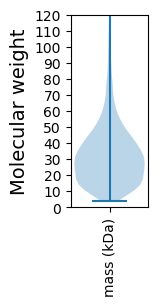
Avg. Mol. Weight |
|---|---|---|---|---|---|---|---|
0 |
2039900 |
39 |
3401 |
319.0 |
34.18 |
Amino acid frequency
Ala |
Cys |
Asp |
Glu |
Phe |
Gly |
His |
Ile |
Lys |
Leu |
|---|---|---|---|---|---|---|---|---|---|
13.932 ± 0.053 | 0.745 ± 0.008 |
5.93 ± 0.028 | 5.231 ± 0.031 |
2.713 ± 0.02 | 9.274 ± 0.034 |
2.116 ± 0.014 | 3.374 ± 0.021 |
1.784 ± 0.022 | 10.571 ± 0.04 |
Met |
Asn |
Gln |
Pro |
Arg |
Ser |
Thr |
Val |
Trp |
Tyr |
|---|---|---|---|---|---|---|---|---|---|
1.674 ± 0.012 | 1.787 ± 0.017 |
6.333 ± 0.029 | 2.775 ± 0.016 |
8.531 ± 0.035 | 4.695 ± 0.021 |
5.887 ± 0.026 | 8.954 ± 0.027 |
1.609 ± 0.014 | 2.085 ± 0.017 |
Most of the basic statistics you can see at this page can be downloaded from this CSV file
See this proteome in:

Proteome-pI is available under Creative Commons Attribution-NoDerivs license, for more details see here
| Reference: Kozlowski LP. Proteome-pI 2.0: Proteome Isoelectric Point Database Update. Nucleic Acids Res. 2021, doi: 10.1093/nar/gkab944 | Contact: Lukasz P. Kozlowski |