bacterium HR11
Taxonomy: cellular organisms; Bacteria; unclassified Bacteria
Average proteome isoelectric point is 7.2
Get precalculated fractions of proteins
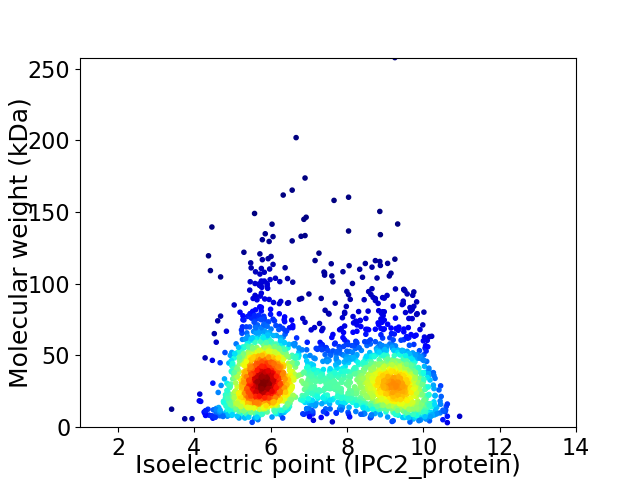
Virtual 2D-PAGE plot for 2436 proteins (isoelectric point calculated using IPC2_protein)
Get csv file with sequences according to given criteria:
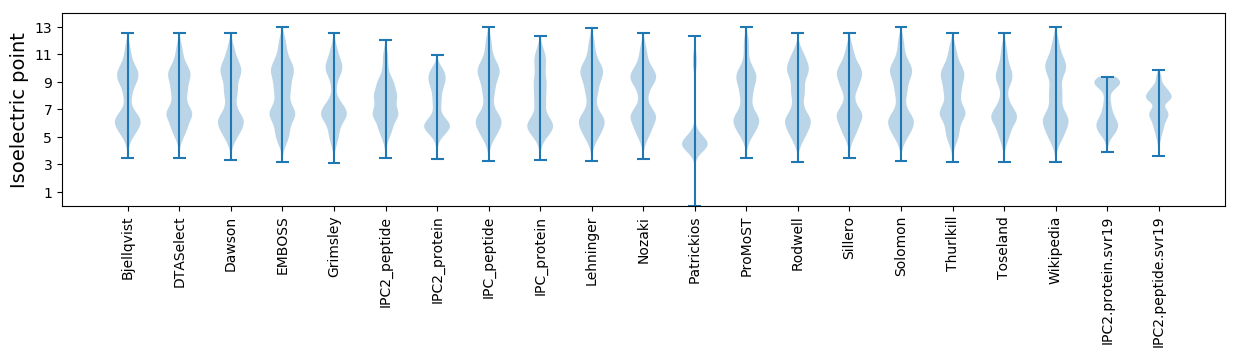
* You can choose from 21 different methods for calculating isoelectric point
Summary statistics related to proteome-wise predictions
Protein with the lowest isoelectric point:
>tr|A0A2H5W8S5|A0A2H5W8S5_9BACT Uncharacterized protein OS=bacterium HR11 OX=2035406 GN=HRbin11_01775 PE=4 SV=1
MM1 pKa = 7.17TAVCPEE7 pKa = 4.12CEE9 pKa = 4.24GPIRR13 pKa = 11.84LAEE16 pKa = 4.32DD17 pKa = 3.3LMEE20 pKa = 5.39GEE22 pKa = 5.5IIPCGDD28 pKa = 3.68CGAEE32 pKa = 4.16LEE34 pKa = 4.47VLSVNPLKK42 pKa = 10.93LGLAPEE48 pKa = 4.3VQEE51 pKa = 4.72DD52 pKa = 3.22WGEE55 pKa = 3.77
MM1 pKa = 7.17TAVCPEE7 pKa = 4.12CEE9 pKa = 4.24GPIRR13 pKa = 11.84LAEE16 pKa = 4.32DD17 pKa = 3.3LMEE20 pKa = 5.39GEE22 pKa = 5.5IIPCGDD28 pKa = 3.68CGAEE32 pKa = 4.16LEE34 pKa = 4.47VLSVNPLKK42 pKa = 10.93LGLAPEE48 pKa = 4.3VQEE51 pKa = 4.72DD52 pKa = 3.22WGEE55 pKa = 3.77
Molecular weight: 5.87 kDa
Isoelectric point according different methods:
Protein with the highest isoelectric point:
>tr|A0A2H5W9P4|A0A2H5W9P4_9BACT RNA 3'-terminal phosphate cyclase OS=bacterium HR11 OX=2035406 GN=rtcA PE=3 SV=1
MM1 pKa = 7.77PKK3 pKa = 10.64AKK5 pKa = 9.55TKK7 pKa = 10.23RR8 pKa = 11.84AAAKK12 pKa = 9.93RR13 pKa = 11.84FRR15 pKa = 11.84ITPTGKK21 pKa = 9.54VMHH24 pKa = 6.03YY25 pKa = 9.37RR26 pKa = 11.84ASRR29 pKa = 11.84SHH31 pKa = 7.32LLRR34 pKa = 11.84KK35 pKa = 8.61KK36 pKa = 6.54TAKK39 pKa = 9.91RR40 pKa = 11.84KK41 pKa = 8.68RR42 pKa = 11.84HH43 pKa = 5.33LRR45 pKa = 11.84HH46 pKa = 6.52PKK48 pKa = 9.79PMAPGDD54 pKa = 3.53ARR56 pKa = 11.84RR57 pKa = 11.84ARR59 pKa = 11.84RR60 pKa = 11.84MLQASS65 pKa = 3.7
MM1 pKa = 7.77PKK3 pKa = 10.64AKK5 pKa = 9.55TKK7 pKa = 10.23RR8 pKa = 11.84AAAKK12 pKa = 9.93RR13 pKa = 11.84FRR15 pKa = 11.84ITPTGKK21 pKa = 9.54VMHH24 pKa = 6.03YY25 pKa = 9.37RR26 pKa = 11.84ASRR29 pKa = 11.84SHH31 pKa = 7.32LLRR34 pKa = 11.84KK35 pKa = 8.61KK36 pKa = 6.54TAKK39 pKa = 9.91RR40 pKa = 11.84KK41 pKa = 8.68RR42 pKa = 11.84HH43 pKa = 5.33LRR45 pKa = 11.84HH46 pKa = 6.52PKK48 pKa = 9.79PMAPGDD54 pKa = 3.53ARR56 pKa = 11.84RR57 pKa = 11.84ARR59 pKa = 11.84RR60 pKa = 11.84MLQASS65 pKa = 3.7
Molecular weight: 7.6 kDa
Isoelectric point according different methods:
Peptides (in silico digests for buttom-up proteomics)
Below you can find in silico digests of the whole proteome with Trypsin, Chymotrypsin, Trypsin+LysC, LysN, ArgC proteases suitable for different mass spec machines.| Try ESI |
 |
|---|
| ChTry ESI |
|
|---|
| ArgC ESI |
|
|---|
| LysN ESI |
|
|---|
| TryLysC ESI |
|
|---|
| Try MALDI |
|
|---|
| ChTry MALDI |
|
|---|
| ArgC MALDI |
|
|---|
| LysN MALDI |
|
|---|
| TryLysC MALDI |
|
|---|
| Try LTQ |
|
|---|
| ChTry LTQ |
|
|---|
| ArgC LTQ |
|
|---|
| LysN LTQ |
|
|---|
| TryLysC LTQ |
|
|---|
| Try MSlow |
|
|---|
| ChTry MSlow |
|
|---|
| ArgC MSlow |
|
|---|
| LysN MSlow |
|
|---|
| TryLysC MSlow |
|
|---|
| Try MShigh |
|
|---|
| ChTry MShigh |
|
|---|
| ArgC MShigh |
|
|---|
| LysN MShigh |
|
|---|
| TryLysC MShigh |
|
|---|
General Statistics
Number of major isoforms |
Number of additional isoforms |
Number of all proteins |
Number of amino acids |
Min. Seq. Length |
Max. Seq. Length |
Avg. Seq. Length |
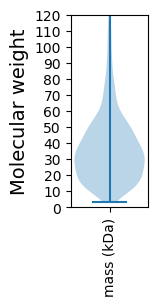
Avg. Mol. Weight |
|---|---|---|---|---|---|---|---|
0 |
832185 |
29 |
2295 |
341.6 |
38.2 |
Amino acid frequency
Ala |
Cys |
Asp |
Glu |
Phe |
Gly |
His |
Ile |
Lys |
Leu |
|---|---|---|---|---|---|---|---|---|---|
10.044 ± 0.049 | 0.923 ± 0.02 |
4.993 ± 0.032 | 6.173 ± 0.045 |
3.617 ± 0.031 | 7.927 ± 0.049 |
2.104 ± 0.022 | 4.172 ± 0.038 |
2.207 ± 0.031 | 10.863 ± 0.048 |
Met |
Asn |
Gln |
Pro |
Arg |
Ser |
Thr |
Val |
Trp |
Tyr |
|---|---|---|---|---|---|---|---|---|---|
1.96 ± 0.019 | 1.721 ± 0.027 |
6.467 ± 0.039 | 3.66 ± 0.04 |
9.476 ± 0.048 | 4.068 ± 0.036 |
5.142 ± 0.033 | 9.12 ± 0.043 |
2.381 ± 0.032 | 2.98 ± 0.028 |
Most of the basic statistics you can see at this page can be downloaded from this CSV file
See this proteome in:

Proteome-pI is available under Creative Commons Attribution-NoDerivs license, for more details see here
| Reference: Kozlowski LP. Proteome-pI 2.0: Proteome Isoelectric Point Database Update. Nucleic Acids Res. 2021, doi: 10.1093/nar/gkab944 | Contact: Lukasz P. Kozlowski |