Tannerella forsythia (strain ATCC 43037 / JCM 10827 / CCUG 33226 / KCTC 5666 / FDC 338) (Bacteroides forsythus)
Taxonomy: cellular organisms; Bacteria; FCB group; Bacteroidetes/Chlorobi group; Bacteroidetes; Bacteroidia; Bacteroidales; Tannerellaceae; Tannerella; Tannerella forsythia
Average proteome isoelectric point is 6.96
Get precalculated fractions of proteins
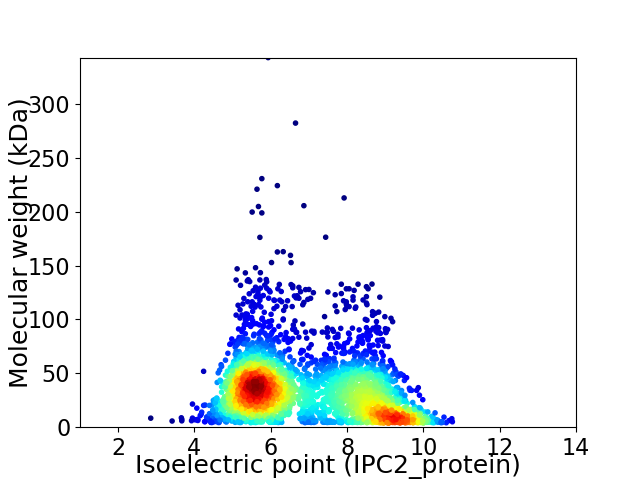
Virtual 2D-PAGE plot for 2978 proteins (isoelectric point calculated using IPC2_protein)
Get csv file with sequences according to given criteria:
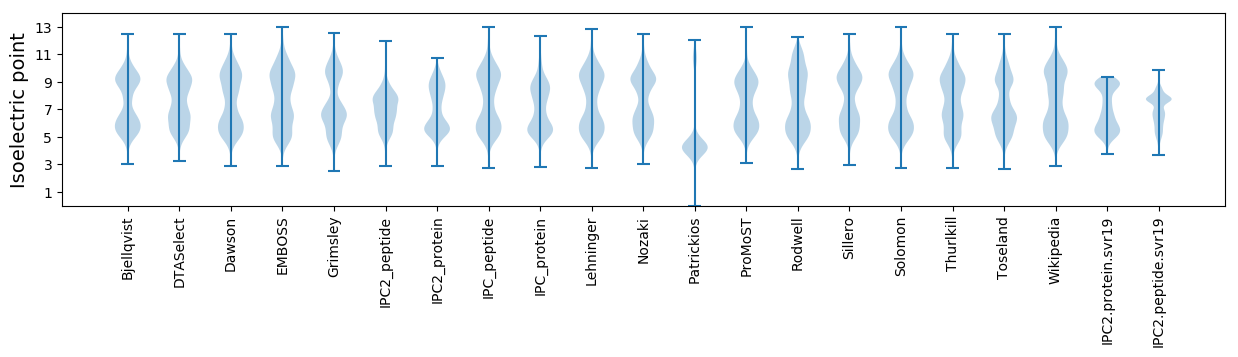
* You can choose from 21 different methods for calculating isoelectric point
Summary statistics related to proteome-wise predictions
Protein with the lowest isoelectric point:
>tr|G8UK42|G8UK42_TANFA Uncharacterized protein OS=Tannerella forsythia (strain ATCC 43037 / JCM 10827 / CCUG 33226 / KCTC 5666 / FDC 338) OX=203275 GN=BFO_0346 PE=4 SV=1
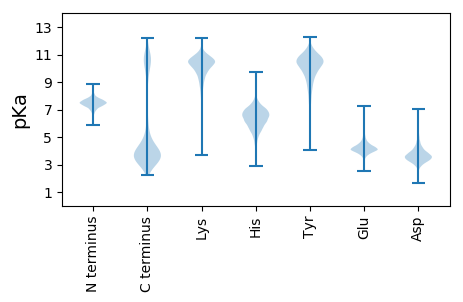
MM1 pKa = 7.48KK2 pKa = 10.09KK3 pKa = 10.1YY4 pKa = 10.52RR5 pKa = 11.84CIVCDD10 pKa = 3.71YY11 pKa = 10.44IYY13 pKa = 10.89DD14 pKa = 4.07PVEE17 pKa = 4.26GDD19 pKa = 3.5PDD21 pKa = 3.9GGIDD25 pKa = 3.74PGTAFEE31 pKa = 6.02DD32 pKa = 4.23IPDD35 pKa = 3.74DD36 pKa = 4.06WVCPLCGVGKK46 pKa = 10.3DD47 pKa = 3.4DD48 pKa = 4.99FEE50 pKa = 4.51PVEE53 pKa = 4.05
MM1 pKa = 7.48KK2 pKa = 10.09KK3 pKa = 10.1YY4 pKa = 10.52RR5 pKa = 11.84CIVCDD10 pKa = 3.71YY11 pKa = 10.44IYY13 pKa = 10.89DD14 pKa = 4.07PVEE17 pKa = 4.26GDD19 pKa = 3.5PDD21 pKa = 3.9GGIDD25 pKa = 3.74PGTAFEE31 pKa = 6.02DD32 pKa = 4.23IPDD35 pKa = 3.74DD36 pKa = 4.06WVCPLCGVGKK46 pKa = 10.3DD47 pKa = 3.4DD48 pKa = 4.99FEE50 pKa = 4.51PVEE53 pKa = 4.05
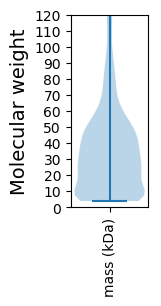
Molecular weight: 5.9 kDa
Isoelectric point according different methods:
Protein with the highest isoelectric point:
>tr|G8UKB5|G8UKB5_TANFA Mannosyl-glycoprotein endo-beta-N-acetylglucosaminidase OS=Tannerella forsythia (strain ATCC 43037 / JCM 10827 / CCUG 33226 / KCTC 5666 / FDC 338) OX=203275 GN=BFO_1375 PE=4 SV=1
MM1 pKa = 7.79RR2 pKa = 11.84PMIKK6 pKa = 8.66KK7 pKa = 8.31TKK9 pKa = 8.39RR10 pKa = 11.84QQLGRR15 pKa = 11.84VLNIALNVFNGISMIIIGFLLMRR38 pKa = 11.84VFVFGSS44 pKa = 3.28
MM1 pKa = 7.79RR2 pKa = 11.84PMIKK6 pKa = 8.66KK7 pKa = 8.31TKK9 pKa = 8.39RR10 pKa = 11.84QQLGRR15 pKa = 11.84VLNIALNVFNGISMIIIGFLLMRR38 pKa = 11.84VFVFGSS44 pKa = 3.28
Molecular weight: 5.05 kDa
Isoelectric point according different methods:
Peptides (in silico digests for buttom-up proteomics)
Below you can find in silico digests of the whole proteome with Trypsin, Chymotrypsin, Trypsin+LysC, LysN, ArgC proteases suitable for different mass spec machines.| Try ESI |
 |
|---|
| ChTry ESI |
|
|---|
| ArgC ESI |
|
|---|
| LysN ESI |
|
|---|
| TryLysC ESI |
|
|---|
| Try MALDI |
|
|---|
| ChTry MALDI |
|
|---|
| ArgC MALDI |
|
|---|
| LysN MALDI |
|
|---|
| TryLysC MALDI |
|
|---|
| Try LTQ |
|
|---|
| ChTry LTQ |
|
|---|
| ArgC LTQ |
|
|---|
| LysN LTQ |
|
|---|
| TryLysC LTQ |
|
|---|
| Try MSlow |
|
|---|
| ChTry MSlow |
|
|---|
| ArgC MSlow |
|
|---|
| LysN MSlow |
|
|---|
| TryLysC MSlow |
|
|---|
| Try MShigh |
|
|---|
| ChTry MShigh |
|
|---|
| ArgC MShigh |
|
|---|
| LysN MShigh |
|
|---|
| TryLysC MShigh |
|
|---|
General Statistics
Number of major isoforms |
Number of additional isoforms |
Number of all proteins |
Number of amino acids |
Min. Seq. Length |
Max. Seq. Length |
Avg. Seq. Length |
Avg. Mol. Weight |
|---|---|---|---|---|---|---|---|
0 |
978559 |
37 |
3058 |
328.6 |
37.18 |
Amino acid frequency
Ala |
Cys |
Asp |
Glu |
Phe |
Gly |
His |
Ile |
Lys |
Leu |
|---|---|---|---|---|---|---|---|---|---|
7.098 ± 0.044 | 1.2 ± 0.019 |
5.418 ± 0.03 | 6.416 ± 0.045 |
4.666 ± 0.035 | 6.837 ± 0.044 |
2.086 ± 0.022 | 6.742 ± 0.039 |
6.282 ± 0.045 | 9.093 ± 0.048 |
Met |
Asn |
Gln |
Pro |
Arg |
Ser |
Thr |
Val |
Trp |
Tyr |
|---|---|---|---|---|---|---|---|---|---|
2.752 ± 0.022 | 4.693 ± 0.039 |
3.888 ± 0.027 | 3.348 ± 0.027 |
5.563 ± 0.038 | 6.107 ± 0.039 |
5.775 ± 0.044 | 6.394 ± 0.037 |
1.234 ± 0.017 | 4.408 ± 0.03 |
Most of the basic statistics you can see at this page can be downloaded from this CSV file
See this proteome in:

Proteome-pI is available under Creative Commons Attribution-NoDerivs license, for more details see here
| Reference: Kozlowski LP. Proteome-pI 2.0: Proteome Isoelectric Point Database Update. Nucleic Acids Res. 2021, doi: 10.1093/nar/gkab944 | Contact: Lukasz P. Kozlowski |