Salmonella virus VSt472
Taxonomy: Viruses; Duplodnaviria; Heunggongvirae; Uroviricota; Caudoviricetes; Caudovirales; Siphoviridae; unclassified Siphoviridae
Average proteome isoelectric point is 6.6
Get precalculated fractions of proteins
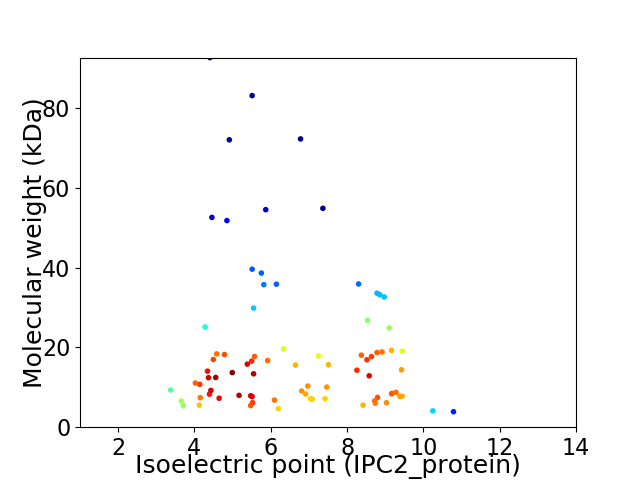
Virtual 2D-PAGE plot for 82 proteins (isoelectric point calculated using IPC2_protein)
Get csv file with sequences according to given criteria:
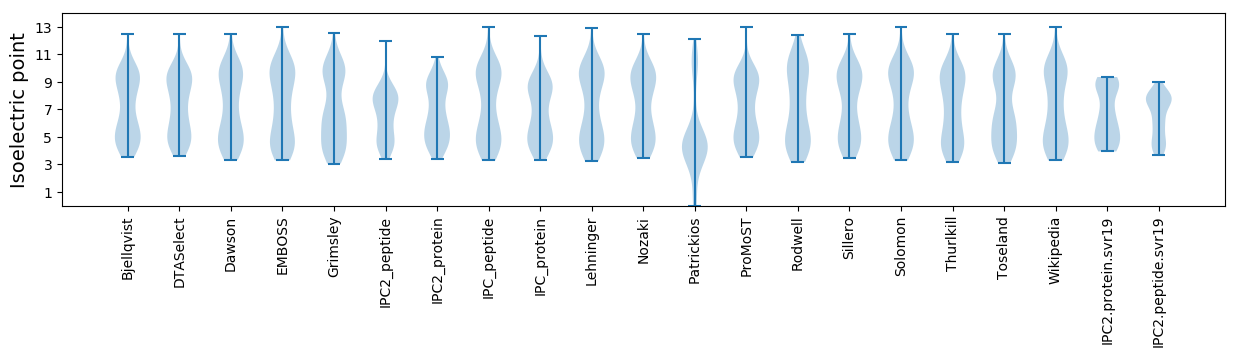
* You can choose from 21 different methods for calculating isoelectric point
Summary statistics related to proteome-wise predictions


Protein with the lowest isoelectric point:
>tr|A0A385EGL6|A0A385EGL6_9CAUD Uncharacterized protein OS=Salmonella virus VSt472 OX=2301723 GN=vst472_48 PE=4 SV=1
MM1 pKa = 7.66ANMSYY6 pKa = 10.72CRR8 pKa = 11.84FRR10 pKa = 11.84NTEE13 pKa = 3.48QDD15 pKa = 3.71FNDD18 pKa = 3.9CVDD21 pKa = 4.39AIGNIEE27 pKa = 5.01SIDD30 pKa = 3.68EE31 pKa = 4.12LSNAEE36 pKa = 4.0RR37 pKa = 11.84KK38 pKa = 9.38SAEE41 pKa = 3.73RR42 pKa = 11.84LYY44 pKa = 11.18YY45 pKa = 10.32LANEE49 pKa = 4.16YY50 pKa = 9.7IAYY53 pKa = 9.95YY54 pKa = 9.75EE55 pKa = 3.92QLLEE59 pKa = 4.22EE60 pKa = 4.58SGEE63 pKa = 4.05
MM1 pKa = 7.66ANMSYY6 pKa = 10.72CRR8 pKa = 11.84FRR10 pKa = 11.84NTEE13 pKa = 3.48QDD15 pKa = 3.71FNDD18 pKa = 3.9CVDD21 pKa = 4.39AIGNIEE27 pKa = 5.01SIDD30 pKa = 3.68EE31 pKa = 4.12LSNAEE36 pKa = 4.0RR37 pKa = 11.84KK38 pKa = 9.38SAEE41 pKa = 3.73RR42 pKa = 11.84LYY44 pKa = 11.18YY45 pKa = 10.32LANEE49 pKa = 4.16YY50 pKa = 9.7IAYY53 pKa = 9.95YY54 pKa = 9.75EE55 pKa = 3.92QLLEE59 pKa = 4.22EE60 pKa = 4.58SGEE63 pKa = 4.05
Molecular weight: 7.4 kDa
Isoelectric point according different methods:
Protein with the highest isoelectric point:
>tr|A0A385EH99|A0A385EH99_9CAUD Uncharacterized protein OS=Salmonella virus VSt472 OX=2301723 GN=vst472_71 PE=4 SV=1
MM1 pKa = 7.72GSTNGPSRR9 pKa = 11.84SRR11 pKa = 11.84ATGNTKK17 pKa = 9.72TGGKK21 pKa = 7.78TGAVKK26 pKa = 10.54PNGSTRR32 pKa = 11.84SPSRR36 pKa = 11.84GKK38 pKa = 10.36KK39 pKa = 9.35
MM1 pKa = 7.72GSTNGPSRR9 pKa = 11.84SRR11 pKa = 11.84ATGNTKK17 pKa = 9.72TGGKK21 pKa = 7.78TGAVKK26 pKa = 10.54PNGSTRR32 pKa = 11.84SPSRR36 pKa = 11.84GKK38 pKa = 10.36KK39 pKa = 9.35
Molecular weight: 3.88 kDa
Isoelectric point according different methods:
Peptides (in silico digests for buttom-up proteomics)
Below you can find in silico digests of the whole proteome with Trypsin, Chymotrypsin, Trypsin+LysC, LysN, ArgC proteases suitable for different mass spec machines.| Try ESI |
 |
|---|
| ChTry ESI |
|
|---|
| ArgC ESI |
|
|---|
| LysN ESI |
|
|---|
| TryLysC ESI |
|
|---|
| Try MALDI |
|
|---|
| ChTry MALDI |
|
|---|
| ArgC MALDI |
|
|---|
| LysN MALDI |
|
|---|
| TryLysC MALDI |
|
|---|
| Try LTQ |
|
|---|
| ChTry LTQ |
|
|---|
| ArgC LTQ |
|
|---|
| LysN LTQ |
|
|---|
| TryLysC LTQ |
|
|---|
| Try MSlow |
|
|---|
| ChTry MSlow |
|
|---|
| ArgC MSlow |
|
|---|
| LysN MSlow |
|
|---|
| TryLysC MSlow |
|
|---|
| Try MShigh |
|
|---|
| ChTry MShigh |
|
|---|
| ArgC MShigh |
|
|---|
| LysN MShigh |
|
|---|
| TryLysC MShigh |
|
|---|
General Statistics
Number of major isoforms |
Number of additional isoforms |
Number of all proteins |
Number of amino acids |
Min. Seq. Length |
Max. Seq. Length |
Avg. Seq. Length |
Avg. Mol. Weight |
|---|---|---|---|---|---|---|---|
0 |
14445 |
37 |
829 |
176.2 |
19.74 |
Amino acid frequency
Ala |
Cys |
Asp |
Glu |
Phe |
Gly |
His |
Ile |
Lys |
Leu |
|---|---|---|---|---|---|---|---|---|---|
8.46 ± 0.522 | 1.641 ± 0.174 |
6.321 ± 0.277 | 6.584 ± 0.308 |
3.454 ± 0.148 | 7.214 ± 0.312 |
1.959 ± 0.207 | 6.625 ± 0.218 |
6.916 ± 0.413 | 7.034 ± 0.232 |
Met |
Asn |
Gln |
Pro |
Arg |
Ser |
Thr |
Val |
Trp |
Tyr |
|---|---|---|---|---|---|---|---|---|---|
3.053 ± 0.162 | 4.618 ± 0.213 |
3.274 ± 0.226 | 3.78 ± 0.267 |
5.351 ± 0.236 | 6.604 ± 0.26 |
5.434 ± 0.372 | 6.341 ± 0.281 |
1.585 ± 0.124 | 3.752 ± 0.19 |
Most of the basic statistics you can see at this page can be downloaded from this CSV file
See this proteome in:

Proteome-pI is available under Creative Commons Attribution-NoDerivs license, for more details see here
| Reference: Kozlowski LP. Proteome-pI 2.0: Proteome Isoelectric Point Database Update. Nucleic Acids Res. 2021, doi: 10.1093/nar/gkab944 | Contact: Lukasz P. Kozlowski |