Phlox virus S
Taxonomy: Viruses; Riboviria; Orthornavirae; Kitrinoviricota; Alsuviricetes; Tymovirales; Betaflexiviridae; Quinvirinae; Carlavirus
Average proteome isoelectric point is 7.07
Get precalculated fractions of proteins
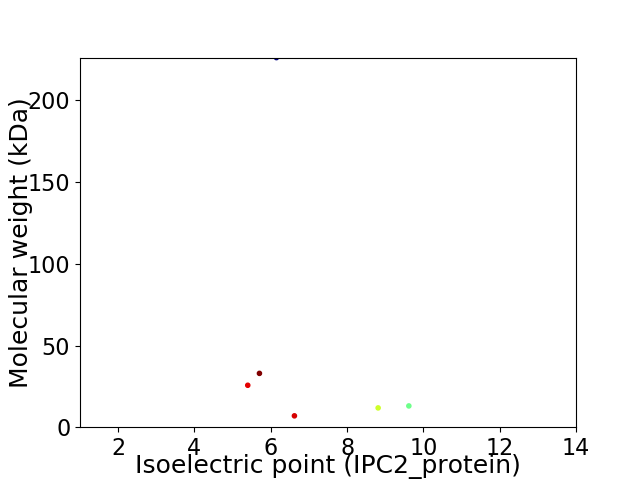
Virtual 2D-PAGE plot for 6 proteins (isoelectric point calculated using IPC2_protein)
Get csv file with sequences according to given criteria:
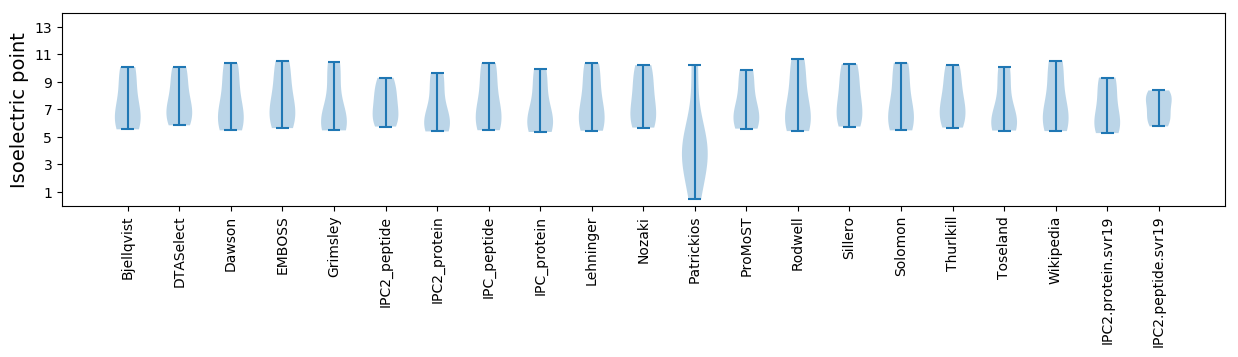
* You can choose from 21 different methods for calculating isoelectric point
Summary statistics related to proteome-wise predictions
Protein with the lowest isoelectric point:
>tr|A4ZWC7|A4ZWC7_9VIRU Movement protein TGB2 OS=Phlox virus S OX=436066 PE=3 SV=1
MM1 pKa = 8.15DD2 pKa = 4.74ILVSLLCKK10 pKa = 10.7YY11 pKa = 10.47KK12 pKa = 10.69FEE14 pKa = 4.54RR15 pKa = 11.84LNSKK19 pKa = 10.13LCLPIIVNCVPGAGKK34 pKa = 10.18SSCIRR39 pKa = 11.84EE40 pKa = 4.48LISSDD45 pKa = 3.82SRR47 pKa = 11.84FCAYY51 pKa = 9.5TLGTEE56 pKa = 4.45DD57 pKa = 3.75PQNLRR62 pKa = 11.84GVRR65 pKa = 11.84IKK67 pKa = 10.74SFKK70 pKa = 11.18GEE72 pKa = 3.8IEE74 pKa = 3.8EE75 pKa = 4.85GKK77 pKa = 10.85FNVLDD82 pKa = 4.39EE83 pKa = 4.48YY84 pKa = 11.06TLSEE88 pKa = 4.03VDD90 pKa = 3.32LSKK93 pKa = 11.09FFVCFGDD100 pKa = 4.63PIQANSDD107 pKa = 3.53FARR110 pKa = 11.84PADD113 pKa = 4.72FICRR117 pKa = 11.84DD118 pKa = 3.19SKK120 pKa = 11.41RR121 pKa = 11.84FGKK124 pKa = 8.53CTATLLQNLGFDD136 pKa = 3.85IKK138 pKa = 11.23ACGEE142 pKa = 4.31DD143 pKa = 3.34SVQIAGIYY151 pKa = 10.26SEE153 pKa = 4.96DD154 pKa = 3.57PRR156 pKa = 11.84DD157 pKa = 3.23TVLYY161 pKa = 10.24HH162 pKa = 6.16EE163 pKa = 5.13EE164 pKa = 4.0EE165 pKa = 4.56VGCLLAKK172 pKa = 10.16HH173 pKa = 5.88CVEE176 pKa = 4.58AFHH179 pKa = 8.06ISEE182 pKa = 4.33VVGRR186 pKa = 11.84TFEE189 pKa = 4.18SVTFVTSHH197 pKa = 6.92AGVDD201 pKa = 3.66HH202 pKa = 7.83PDD204 pKa = 3.11RR205 pKa = 11.84AAAFQCLTRR214 pKa = 11.84HH215 pKa = 5.95RR216 pKa = 11.84KK217 pKa = 8.83SLLILCPDD225 pKa = 3.47ATYY228 pKa = 10.87GPPP231 pKa = 3.21
MM1 pKa = 8.15DD2 pKa = 4.74ILVSLLCKK10 pKa = 10.7YY11 pKa = 10.47KK12 pKa = 10.69FEE14 pKa = 4.54RR15 pKa = 11.84LNSKK19 pKa = 10.13LCLPIIVNCVPGAGKK34 pKa = 10.18SSCIRR39 pKa = 11.84EE40 pKa = 4.48LISSDD45 pKa = 3.82SRR47 pKa = 11.84FCAYY51 pKa = 9.5TLGTEE56 pKa = 4.45DD57 pKa = 3.75PQNLRR62 pKa = 11.84GVRR65 pKa = 11.84IKK67 pKa = 10.74SFKK70 pKa = 11.18GEE72 pKa = 3.8IEE74 pKa = 3.8EE75 pKa = 4.85GKK77 pKa = 10.85FNVLDD82 pKa = 4.39EE83 pKa = 4.48YY84 pKa = 11.06TLSEE88 pKa = 4.03VDD90 pKa = 3.32LSKK93 pKa = 11.09FFVCFGDD100 pKa = 4.63PIQANSDD107 pKa = 3.53FARR110 pKa = 11.84PADD113 pKa = 4.72FICRR117 pKa = 11.84DD118 pKa = 3.19SKK120 pKa = 11.41RR121 pKa = 11.84FGKK124 pKa = 8.53CTATLLQNLGFDD136 pKa = 3.85IKK138 pKa = 11.23ACGEE142 pKa = 4.31DD143 pKa = 3.34SVQIAGIYY151 pKa = 10.26SEE153 pKa = 4.96DD154 pKa = 3.57PRR156 pKa = 11.84DD157 pKa = 3.23TVLYY161 pKa = 10.24HH162 pKa = 6.16EE163 pKa = 5.13EE164 pKa = 4.0EE165 pKa = 4.56VGCLLAKK172 pKa = 10.16HH173 pKa = 5.88CVEE176 pKa = 4.58AFHH179 pKa = 8.06ISEE182 pKa = 4.33VVGRR186 pKa = 11.84TFEE189 pKa = 4.18SVTFVTSHH197 pKa = 6.92AGVDD201 pKa = 3.66HH202 pKa = 7.83PDD204 pKa = 3.11RR205 pKa = 11.84AAAFQCLTRR214 pKa = 11.84HH215 pKa = 5.95RR216 pKa = 11.84KK217 pKa = 8.83SLLILCPDD225 pKa = 3.47ATYY228 pKa = 10.87GPPP231 pKa = 3.21
Molecular weight: 25.66 kDa
Isoelectric point according different methods:
Protein with the highest isoelectric point:
>tr|A4ZWD0|A4ZWD0_9VIRU RNA silencing suppressor OS=Phlox virus S OX=436066 PE=3 SV=1
MM1 pKa = 7.69KK2 pKa = 10.18YY3 pKa = 9.01DD4 pKa = 3.68TVKK7 pKa = 10.98SEE9 pKa = 4.59IIFILLSKK17 pKa = 10.21CLEE20 pKa = 4.47RR21 pKa = 11.84GASAPLPIVCNIYY34 pKa = 9.52MRR36 pKa = 11.84AFNKK40 pKa = 10.16RR41 pKa = 11.84VGNGTSSYY49 pKa = 10.52ARR51 pKa = 11.84RR52 pKa = 11.84RR53 pKa = 11.84RR54 pKa = 11.84AASILRR60 pKa = 11.84CHH62 pKa = 6.39RR63 pKa = 11.84CYY65 pKa = 10.12RR66 pKa = 11.84VYY68 pKa = 10.75PPFWFTKK75 pKa = 8.7KK76 pKa = 10.42CNNRR80 pKa = 11.84TCVPGFKK87 pKa = 10.43YY88 pKa = 9.65NQKK91 pKa = 9.56VRR93 pKa = 11.84DD94 pKa = 4.54FILWGVTEE102 pKa = 4.88VIPHH106 pKa = 6.76PGYY109 pKa = 11.18NFF111 pKa = 3.42
MM1 pKa = 7.69KK2 pKa = 10.18YY3 pKa = 9.01DD4 pKa = 3.68TVKK7 pKa = 10.98SEE9 pKa = 4.59IIFILLSKK17 pKa = 10.21CLEE20 pKa = 4.47RR21 pKa = 11.84GASAPLPIVCNIYY34 pKa = 9.52MRR36 pKa = 11.84AFNKK40 pKa = 10.16RR41 pKa = 11.84VGNGTSSYY49 pKa = 10.52ARR51 pKa = 11.84RR52 pKa = 11.84RR53 pKa = 11.84RR54 pKa = 11.84AASILRR60 pKa = 11.84CHH62 pKa = 6.39RR63 pKa = 11.84CYY65 pKa = 10.12RR66 pKa = 11.84VYY68 pKa = 10.75PPFWFTKK75 pKa = 8.7KK76 pKa = 10.42CNNRR80 pKa = 11.84TCVPGFKK87 pKa = 10.43YY88 pKa = 9.65NQKK91 pKa = 9.56VRR93 pKa = 11.84DD94 pKa = 4.54FILWGVTEE102 pKa = 4.88VIPHH106 pKa = 6.76PGYY109 pKa = 11.18NFF111 pKa = 3.42
Molecular weight: 13.02 kDa
Isoelectric point according different methods:
Peptides (in silico digests for buttom-up proteomics)
Below you can find in silico digests of the whole proteome with Trypsin, Chymotrypsin, Trypsin+LysC, LysN, ArgC proteases suitable for different mass spec machines.| Try ESI |
 |
|---|
| ChTry ESI |
|
|---|
| ArgC ESI |
|
|---|
| LysN ESI |
|
|---|
| TryLysC ESI |
|
|---|
| Try MALDI |
|
|---|
| ChTry MALDI |
|
|---|
| ArgC MALDI |
|
|---|
| LysN MALDI |
|
|---|
| TryLysC MALDI |
|
|---|
| Try LTQ |
|
|---|
| ChTry LTQ |
|
|---|
| ArgC LTQ |
|
|---|
| LysN LTQ |
|
|---|
| TryLysC LTQ |
|
|---|
| Try MSlow |
|
|---|
| ChTry MSlow |
|
|---|
| ArgC MSlow |
|
|---|
| LysN MSlow |
|
|---|
| TryLysC MSlow |
|
|---|
| Try MShigh |
|
|---|
| ChTry MShigh |
|
|---|
| ArgC MShigh |
|
|---|
| LysN MShigh |
|
|---|
| TryLysC MShigh |
|
|---|
General Statistics
Number of major isoforms |
Number of additional isoforms |
Number of all proteins |
Number of amino acids |
Min. Seq. Length |
Max. Seq. Length |
Avg. Seq. Length |
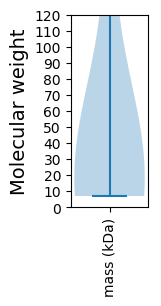
Avg. Mol. Weight |
|---|---|---|---|---|---|---|---|
0 |
2802 |
64 |
1990 |
467.0 |
52.76 |
Amino acid frequency
Ala |
Cys |
Asp |
Glu |
Phe |
Gly |
His |
Ile |
Lys |
Leu |
|---|---|---|---|---|---|---|---|---|---|
6.959 ± 0.418 | 3.034 ± 0.887 |
4.889 ± 0.602 | 7.031 ± 1.186 |
5.71 ± 0.495 | 6.21 ± 0.262 |
2.463 ± 0.356 | 4.889 ± 0.527 |
6.602 ± 0.886 | 9.493 ± 0.881 |
Met |
Asn |
Gln |
Pro |
Arg |
Ser |
Thr |
Val |
Trp |
Tyr |
|---|---|---|---|---|---|---|---|---|---|
2.391 ± 0.505 | 4.604 ± 0.586 |
4.497 ± 0.87 | 2.891 ± 0.331 |
5.318 ± 0.785 | 6.638 ± 0.398 |
4.532 ± 0.578 | 7.209 ± 0.574 |
1.106 ± 0.201 | 3.533 ± 0.34 |
Most of the basic statistics you can see at this page can be downloaded from this CSV file
See this proteome in:

Proteome-pI is available under Creative Commons Attribution-NoDerivs license, for more details see here
| Reference: Kozlowski LP. Proteome-pI 2.0: Proteome Isoelectric Point Database Update. Nucleic Acids Res. 2021, doi: 10.1093/nar/gkab944 | Contact: Lukasz P. Kozlowski |