Pseudoalteromonas phage SL25
Taxonomy: Viruses; Duplodnaviria; Heunggongvirae; Uroviricota; Caudoviricetes; Caudovirales; Siphoviridae; unclassified Siphoviridae
Average proteome isoelectric point is 6.38
Get precalculated fractions of proteins
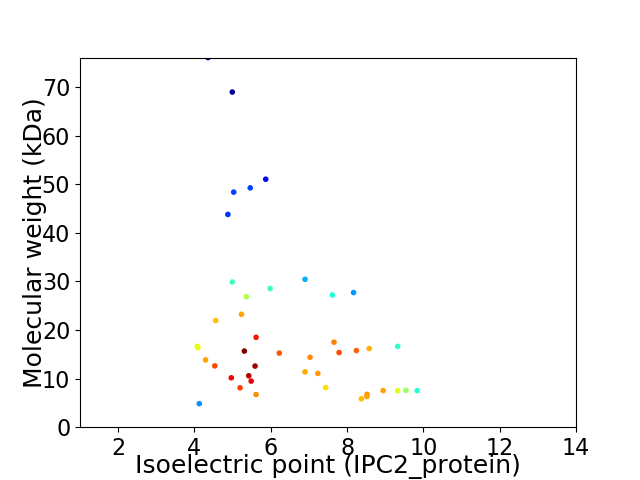
Virtual 2D-PAGE plot for 44 proteins (isoelectric point calculated using IPC2_protein)
Get csv file with sequences according to given criteria:
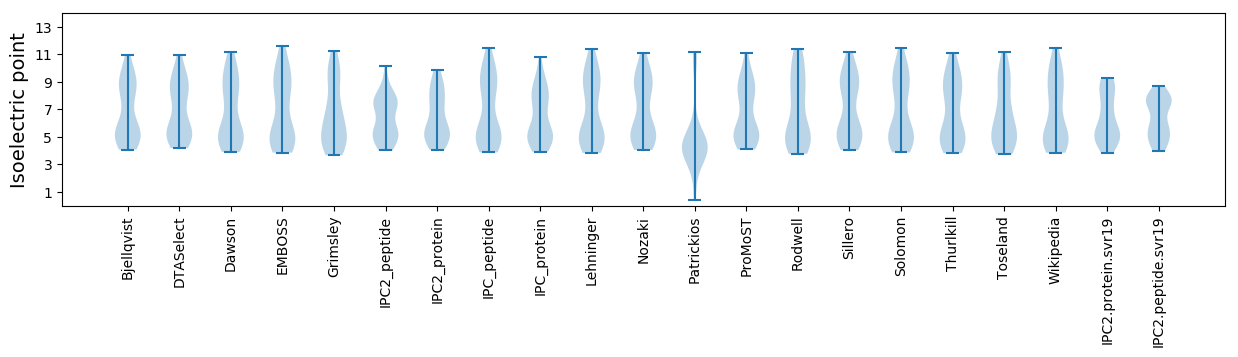
* You can choose from 21 different methods for calculating isoelectric point
Summary statistics related to proteome-wise predictions
Protein with the lowest isoelectric point:
>tr|A0A223LG52|A0A223LG52_9CAUD Gene transfer agent prohead protease OS=Pseudoalteromonas phage SL25 OX=2023999 PE=4 SV=1
MM1 pKa = 7.34TPAEE5 pKa = 4.51YY6 pKa = 10.52LVLWDD11 pKa = 4.04YY12 pKa = 11.58KK13 pKa = 10.75YY14 pKa = 10.71ATAPEE19 pKa = 4.12YY20 pKa = 11.08AEE22 pKa = 3.76QRR24 pKa = 11.84KK25 pKa = 9.47ASEE28 pKa = 4.37LDD30 pKa = 3.12QALIDD35 pKa = 3.89NWDD38 pKa = 3.67LLLL41 pKa = 5.35
MM1 pKa = 7.34TPAEE5 pKa = 4.51YY6 pKa = 10.52LVLWDD11 pKa = 4.04YY12 pKa = 11.58KK13 pKa = 10.75YY14 pKa = 10.71ATAPEE19 pKa = 4.12YY20 pKa = 11.08AEE22 pKa = 3.76QRR24 pKa = 11.84KK25 pKa = 9.47ASEE28 pKa = 4.37LDD30 pKa = 3.12QALIDD35 pKa = 3.89NWDD38 pKa = 3.67LLLL41 pKa = 5.35
Molecular weight: 4.85 kDa
Isoelectric point according different methods:
Protein with the highest isoelectric point:
>tr|A0A223LHE3|A0A223LHE3_9CAUD Uncharacterized protein OS=Pseudoalteromonas phage SL25 OX=2023999 PE=4 SV=1
MM1 pKa = 7.48NNLSDD6 pKa = 3.71MTDD9 pKa = 3.04LSFTQTKK16 pKa = 10.18RR17 pKa = 11.84AMQSTPLSRR26 pKa = 11.84VKK28 pKa = 10.63GQYY31 pKa = 10.06RR32 pKa = 11.84PMWAIAATNNRR43 pKa = 11.84KK44 pKa = 9.25PKK46 pKa = 10.25VLIDD50 pKa = 3.48RR51 pKa = 11.84VRR53 pKa = 11.84DD54 pKa = 3.89GKK56 pKa = 10.8RR57 pKa = 11.84SNPTVFMGCC66 pKa = 3.58
MM1 pKa = 7.48NNLSDD6 pKa = 3.71MTDD9 pKa = 3.04LSFTQTKK16 pKa = 10.18RR17 pKa = 11.84AMQSTPLSRR26 pKa = 11.84VKK28 pKa = 10.63GQYY31 pKa = 10.06RR32 pKa = 11.84PMWAIAATNNRR43 pKa = 11.84KK44 pKa = 9.25PKK46 pKa = 10.25VLIDD50 pKa = 3.48RR51 pKa = 11.84VRR53 pKa = 11.84DD54 pKa = 3.89GKK56 pKa = 10.8RR57 pKa = 11.84SNPTVFMGCC66 pKa = 3.58
Molecular weight: 7.53 kDa
Isoelectric point according different methods:
Peptides (in silico digests for buttom-up proteomics)
Below you can find in silico digests of the whole proteome with Trypsin, Chymotrypsin, Trypsin+LysC, LysN, ArgC proteases suitable for different mass spec machines.| Try ESI |
 |
|---|
| ChTry ESI |
|
|---|
| ArgC ESI |
|
|---|
| LysN ESI |
|
|---|
| TryLysC ESI |
|
|---|
| Try MALDI |
|
|---|
| ChTry MALDI |
|
|---|
| ArgC MALDI |
|
|---|
| LysN MALDI |
|
|---|
| TryLysC MALDI |
|
|---|
| Try LTQ |
|
|---|
| ChTry LTQ |
|
|---|
| ArgC LTQ |
|
|---|
| LysN LTQ |
|
|---|
| TryLysC LTQ |
|
|---|
| Try MSlow |
|
|---|
| ChTry MSlow |
|
|---|
| ArgC MSlow |
|
|---|
| LysN MSlow |
|
|---|
| TryLysC MSlow |
|
|---|
| Try MShigh |
|
|---|
| ChTry MShigh |
|
|---|
| ArgC MShigh |
|
|---|
| LysN MShigh |
|
|---|
| TryLysC MShigh |
|
|---|
General Statistics
Number of major isoforms |
Number of additional isoforms |
Number of all proteins |
Number of amino acids |
Min. Seq. Length |
Max. Seq. Length |
Avg. Seq. Length |
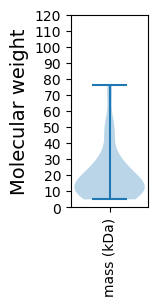
Avg. Mol. Weight |
|---|---|---|---|---|---|---|---|
0 |
8091 |
41 |
706 |
183.9 |
20.46 |
Amino acid frequency
Ala |
Cys |
Asp |
Glu |
Phe |
Gly |
His |
Ile |
Lys |
Leu |
|---|---|---|---|---|---|---|---|---|---|
8.701 ± 0.671 | 1.125 ± 0.189 |
5.908 ± 0.326 | 6.884 ± 0.33 |
3.597 ± 0.174 | 7.045 ± 0.56 |
1.298 ± 0.232 | 6.18 ± 0.24 |
6.946 ± 0.456 | 8.244 ± 0.339 |
Met |
Asn |
Gln |
Pro |
Arg |
Ser |
Thr |
Val |
Trp |
Tyr |
|---|---|---|---|---|---|---|---|---|---|
2.83 ± 0.251 | 5.488 ± 0.311 |
3.349 ± 0.306 | 4.338 ± 0.426 |
4.252 ± 0.336 | 6.761 ± 0.437 |
6.254 ± 0.387 | 5.821 ± 0.237 |
1.335 ± 0.178 | 3.646 ± 0.313 |
Most of the basic statistics you can see at this page can be downloaded from this CSV file
See this proteome in:

Proteome-pI is available under Creative Commons Attribution-NoDerivs license, for more details see here
| Reference: Kozlowski LP. Proteome-pI 2.0: Proteome Isoelectric Point Database Update. Nucleic Acids Res. 2021, doi: 10.1093/nar/gkab944 | Contact: Lukasz P. Kozlowski |