Simian immunodeficiency virus - agm.sab-1
Taxonomy: Viruses; Riboviria; Pararnavirae; Artverviricota; Revtraviricetes; Ortervirales; Retroviridae; Orthoretrovirinae; Lentivirus; Simian immunodeficiency virus; Simian immunodeficiency virus - agm; Simian immunodeficiency virus - agm.sab
Average proteome isoelectric point is 7.62
Get precalculated fractions of proteins
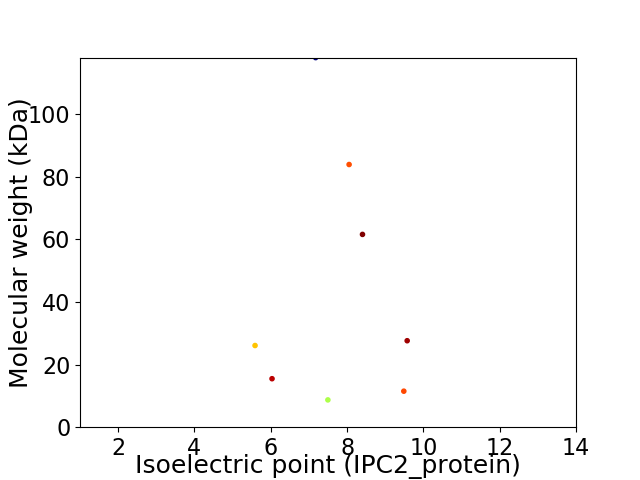
Virtual 2D-PAGE plot for 8 proteins (isoelectric point calculated using IPC2_protein)
Get csv file with sequences according to given criteria:
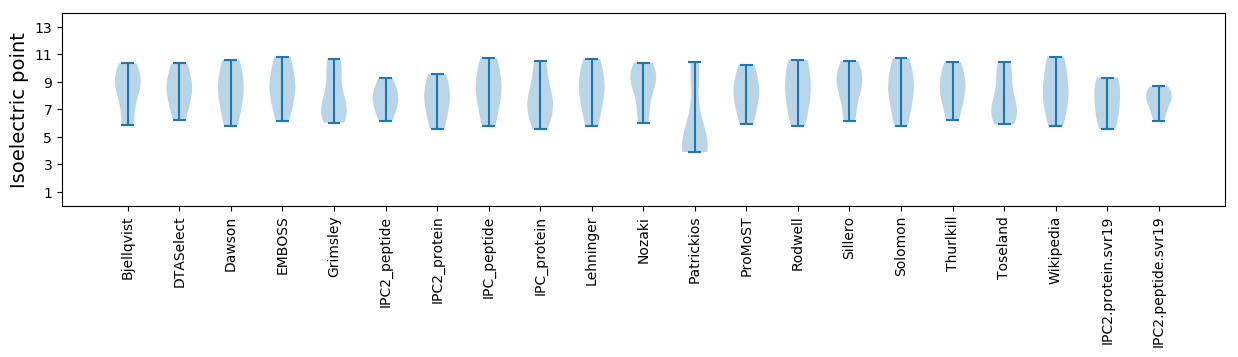
* You can choose from 21 different methods for calculating isoelectric point
Summary statistics related to proteome-wise predictions
Protein with the lowest isoelectric point:
>tr|Q87114|Q87114_SIVSA Protein Nef OS=Simian immunodeficiency virus - agm.sab-1 OX=349974 PE=3 SV=1
MM1 pKa = 7.45GGKK4 pKa = 9.23SSKK7 pKa = 8.35QQQRR11 pKa = 11.84HH12 pKa = 5.13SLWLWSKK19 pKa = 10.46LRR21 pKa = 11.84QAPVIQYY28 pKa = 11.5DD29 pKa = 3.71MLADD33 pKa = 4.09PLLGQSSHH41 pKa = 5.68IQEE44 pKa = 4.33EE45 pKa = 4.84CAKK48 pKa = 10.07SLRR51 pKa = 11.84DD52 pKa = 3.42GLIRR56 pKa = 11.84QGDD59 pKa = 3.75SSRR62 pKa = 11.84TEE64 pKa = 3.76EE65 pKa = 4.27GVKK68 pKa = 9.43MKK70 pKa = 10.49HH71 pKa = 6.13QGRR74 pKa = 11.84QPSWYY79 pKa = 9.91DD80 pKa = 3.18EE81 pKa = 4.57DD82 pKa = 4.09EE83 pKa = 4.65EE84 pKa = 4.76EE85 pKa = 4.25VGFPVRR91 pKa = 11.84PCLPLRR97 pKa = 11.84AMTYY101 pKa = 10.71KK102 pKa = 10.68LAIDD106 pKa = 4.52FGHH109 pKa = 6.47FLKK112 pKa = 10.86EE113 pKa = 3.87KK114 pKa = 10.43GGLEE118 pKa = 4.14GIYY121 pKa = 10.2YY122 pKa = 9.05SEE124 pKa = 4.11RR125 pKa = 11.84RR126 pKa = 11.84KK127 pKa = 10.61KK128 pKa = 10.52ILDD131 pKa = 4.03LYY133 pKa = 11.0ALNEE137 pKa = 3.9WGIVDD142 pKa = 4.07GWQNYY147 pKa = 7.22TDD149 pKa = 4.35GPGTRR154 pKa = 11.84YY155 pKa = 8.82PKK157 pKa = 10.64CFGWCFKK164 pKa = 10.5LVPVDD169 pKa = 4.5LSEE172 pKa = 3.99EE173 pKa = 4.11AKK175 pKa = 10.87NSEE178 pKa = 4.28NHH180 pKa = 6.38CLLHH184 pKa = 6.22PAQVAYY190 pKa = 10.13EE191 pKa = 4.06DD192 pKa = 4.67DD193 pKa = 3.4AWKK196 pKa = 8.39EE197 pKa = 3.95TLVWKK202 pKa = 10.02FDD204 pKa = 3.79PLLAVDD210 pKa = 3.89YY211 pKa = 9.51VAWRR215 pKa = 11.84LHH217 pKa = 6.07PEE219 pKa = 4.08QVPSAQGG226 pKa = 2.99
MM1 pKa = 7.45GGKK4 pKa = 9.23SSKK7 pKa = 8.35QQQRR11 pKa = 11.84HH12 pKa = 5.13SLWLWSKK19 pKa = 10.46LRR21 pKa = 11.84QAPVIQYY28 pKa = 11.5DD29 pKa = 3.71MLADD33 pKa = 4.09PLLGQSSHH41 pKa = 5.68IQEE44 pKa = 4.33EE45 pKa = 4.84CAKK48 pKa = 10.07SLRR51 pKa = 11.84DD52 pKa = 3.42GLIRR56 pKa = 11.84QGDD59 pKa = 3.75SSRR62 pKa = 11.84TEE64 pKa = 3.76EE65 pKa = 4.27GVKK68 pKa = 9.43MKK70 pKa = 10.49HH71 pKa = 6.13QGRR74 pKa = 11.84QPSWYY79 pKa = 9.91DD80 pKa = 3.18EE81 pKa = 4.57DD82 pKa = 4.09EE83 pKa = 4.65EE84 pKa = 4.76EE85 pKa = 4.25VGFPVRR91 pKa = 11.84PCLPLRR97 pKa = 11.84AMTYY101 pKa = 10.71KK102 pKa = 10.68LAIDD106 pKa = 4.52FGHH109 pKa = 6.47FLKK112 pKa = 10.86EE113 pKa = 3.87KK114 pKa = 10.43GGLEE118 pKa = 4.14GIYY121 pKa = 10.2YY122 pKa = 9.05SEE124 pKa = 4.11RR125 pKa = 11.84RR126 pKa = 11.84KK127 pKa = 10.61KK128 pKa = 10.52ILDD131 pKa = 4.03LYY133 pKa = 11.0ALNEE137 pKa = 3.9WGIVDD142 pKa = 4.07GWQNYY147 pKa = 7.22TDD149 pKa = 4.35GPGTRR154 pKa = 11.84YY155 pKa = 8.82PKK157 pKa = 10.64CFGWCFKK164 pKa = 10.5LVPVDD169 pKa = 4.5LSEE172 pKa = 3.99EE173 pKa = 4.11AKK175 pKa = 10.87NSEE178 pKa = 4.28NHH180 pKa = 6.38CLLHH184 pKa = 6.22PAQVAYY190 pKa = 10.13EE191 pKa = 4.06DD192 pKa = 4.67DD193 pKa = 3.4AWKK196 pKa = 8.39EE197 pKa = 3.95TLVWKK202 pKa = 10.02FDD204 pKa = 3.79PLLAVDD210 pKa = 3.89YY211 pKa = 9.51VAWRR215 pKa = 11.84LHH217 pKa = 6.07PEE219 pKa = 4.08QVPSAQGG226 pKa = 2.99
Molecular weight: 26.07 kDa
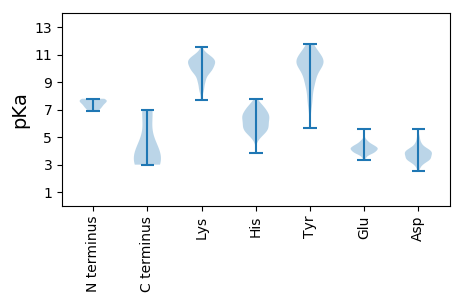
Isoelectric point according different methods:
Protein with the highest isoelectric point:
>tr|Q87113|Q87113_SIVSA Envelope glycoprotein gp160 OS=Simian immunodeficiency virus - agm.sab-1 OX=349974 PE=4 SV=1
MM1 pKa = 7.71SLGQEE6 pKa = 3.73EE7 pKa = 4.75LLRR10 pKa = 11.84RR11 pKa = 11.84FRR13 pKa = 11.84IIKK16 pKa = 9.8FLYY19 pKa = 6.17TTNPYY24 pKa = 10.39PPGQGTARR32 pKa = 11.84QRR34 pKa = 11.84RR35 pKa = 11.84RR36 pKa = 11.84ARR38 pKa = 11.84QRR40 pKa = 11.84WAKK43 pKa = 9.91QRR45 pKa = 11.84QQVIHH50 pKa = 5.79LAEE53 pKa = 5.58RR54 pKa = 11.84ILEE57 pKa = 4.4TPVSQIDD64 pKa = 3.55HH65 pKa = 7.26LAQEE69 pKa = 4.78FDD71 pKa = 4.19QLVLDD76 pKa = 4.91NLQQPPSLPPGHH88 pKa = 6.37PTEE91 pKa = 4.26NQTANSSSS99 pKa = 3.14
MM1 pKa = 7.71SLGQEE6 pKa = 3.73EE7 pKa = 4.75LLRR10 pKa = 11.84RR11 pKa = 11.84FRR13 pKa = 11.84IIKK16 pKa = 9.8FLYY19 pKa = 6.17TTNPYY24 pKa = 10.39PPGQGTARR32 pKa = 11.84QRR34 pKa = 11.84RR35 pKa = 11.84RR36 pKa = 11.84ARR38 pKa = 11.84QRR40 pKa = 11.84WAKK43 pKa = 9.91QRR45 pKa = 11.84QQVIHH50 pKa = 5.79LAEE53 pKa = 5.58RR54 pKa = 11.84ILEE57 pKa = 4.4TPVSQIDD64 pKa = 3.55HH65 pKa = 7.26LAQEE69 pKa = 4.78FDD71 pKa = 4.19QLVLDD76 pKa = 4.91NLQQPPSLPPGHH88 pKa = 6.37PTEE91 pKa = 4.26NQTANSSSS99 pKa = 3.14
Molecular weight: 11.5 kDa
Isoelectric point according different methods:
Peptides (in silico digests for buttom-up proteomics)
Below you can find in silico digests of the whole proteome with Trypsin, Chymotrypsin, Trypsin+LysC, LysN, ArgC proteases suitable for different mass spec machines.| Try ESI |
 |
|---|
| ChTry ESI |
|
|---|
| ArgC ESI |
|
|---|
| LysN ESI |
|
|---|
| TryLysC ESI |
|
|---|
| Try MALDI |
|
|---|
| ChTry MALDI |
|
|---|
| ArgC MALDI |
|
|---|
| LysN MALDI |
|
|---|
| TryLysC MALDI |
|
|---|
| Try LTQ |
|
|---|
| ChTry LTQ |
|
|---|
| ArgC LTQ |
|
|---|
| LysN LTQ |
|
|---|
| TryLysC LTQ |
|
|---|
| Try MSlow |
|
|---|
| ChTry MSlow |
|
|---|
| ArgC MSlow |
|
|---|
| LysN MSlow |
|
|---|
| TryLysC MSlow |
|
|---|
| Try MShigh |
|
|---|
| ChTry MShigh |
|
|---|
| ArgC MShigh |
|
|---|
| LysN MShigh |
|
|---|
| TryLysC MShigh |
|
|---|
General Statistics
Number of major isoforms |
Number of additional isoforms |
Number of all proteins |
Number of amino acids |
Min. Seq. Length |
Max. Seq. Length |
Avg. Seq. Length |
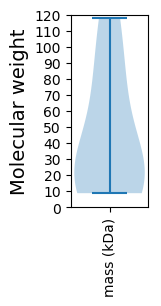
Avg. Mol. Weight |
|---|---|---|---|---|---|---|---|
0 |
3097 |
73 |
1039 |
387.1 |
44.09 |
Amino acid frequency
Ala |
Cys |
Asp |
Glu |
Phe |
Gly |
His |
Ile |
Lys |
Leu |
|---|---|---|---|---|---|---|---|---|---|
6.748 ± 0.333 | 2.228 ± 0.485 |
3.972 ± 0.326 | 6.716 ± 0.508 |
2.712 ± 0.313 | 7.039 ± 0.531 |
2.293 ± 0.393 | 5.651 ± 0.897 |
6.813 ± 0.384 | 8.298 ± 0.278 |
Met |
Asn |
Gln |
Pro |
Arg |
Ser |
Thr |
Val |
Trp |
Tyr |
|---|---|---|---|---|---|---|---|---|---|
1.744 ± 0.155 | 4.488 ± 0.764 |
6.167 ± 0.736 | 6.619 ± 0.66 |
5.683 ± 0.448 | 4.811 ± 0.47 |
5.392 ± 0.516 | 6.103 ± 0.29 |
3.229 ± 0.38 | 3.294 ± 0.274 |
Most of the basic statistics you can see at this page can be downloaded from this CSV file
See this proteome in:

Proteome-pI is available under Creative Commons Attribution-NoDerivs license, for more details see here
| Reference: Kozlowski LP. Proteome-pI 2.0: Proteome Isoelectric Point Database Update. Nucleic Acids Res. 2021, doi: 10.1093/nar/gkab944 | Contact: Lukasz P. Kozlowski |