Oceanicoccus sagamiensis
Taxonomy: cellular organisms; Bacteria; Proteobacteria; Gammaproteobacteria; Cellvibrionales; Spongiibacteraceae; Oceanicoccus
Average proteome isoelectric point is 5.82
Get precalculated fractions of proteins
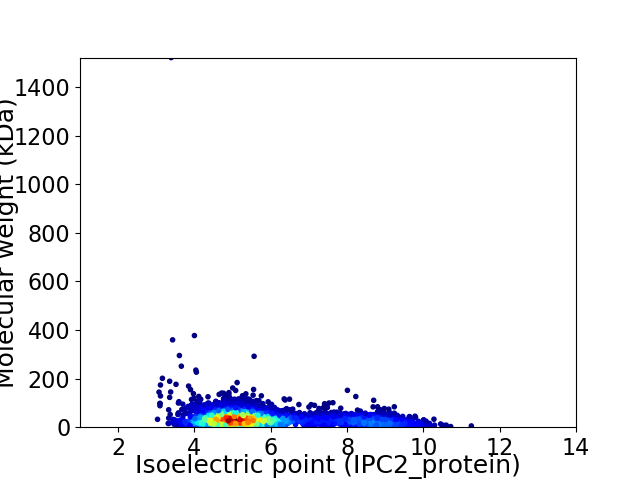
Virtual 2D-PAGE plot for 3870 proteins (isoelectric point calculated using IPC2_protein)
Get csv file with sequences according to given criteria:
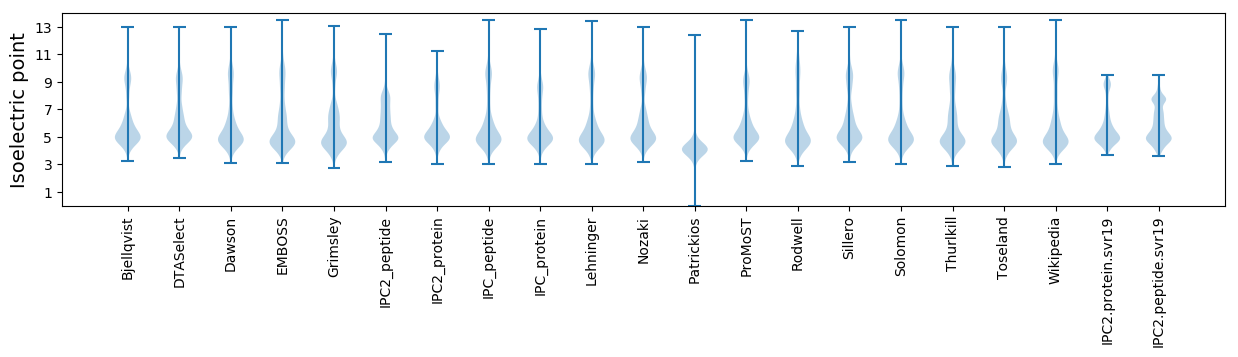
* You can choose from 21 different methods for calculating isoelectric point
Summary statistics related to proteome-wise predictions
Protein with the lowest isoelectric point:
>tr|A0A1X9NII4|A0A1X9NII4_9GAMM STN domain-containing protein OS=Oceanicoccus sagamiensis OX=716816 GN=BST96_06500 PE=3 SV=1
MM1 pKa = 7.3TSNPILLAAFSLALAQPALSQVNMALLGDD30 pKa = 4.62SIIDD34 pKa = 4.16DD35 pKa = 3.88YY36 pKa = 11.65LGPSNSIGTNTNLAAGSFGQILADD60 pKa = 3.73TRR62 pKa = 11.84GADD65 pKa = 3.52INFGAYY71 pKa = 8.51KK72 pKa = 10.64APTANTADD80 pKa = 3.28AWDD83 pKa = 4.11SIRR86 pKa = 11.84NFGYY90 pKa = 10.05EE91 pKa = 4.36YY92 pKa = 11.14NWATAGGTASAQEE105 pKa = 4.29LNLDD109 pKa = 4.02FNGPDD114 pKa = 3.23APGYY118 pKa = 9.49AQIPIASNLAAQVAGLAPSISSGDD142 pKa = 3.0VDD144 pKa = 3.63TAVISVGPNDD154 pKa = 4.02FFYY157 pKa = 10.99HH158 pKa = 5.98SLVIDD163 pKa = 3.72TASGGFYY170 pKa = 9.43PAPDD174 pKa = 3.7GQLDD178 pKa = 3.53QTFTNLVADD187 pKa = 5.14SILEE191 pKa = 4.85GIDD194 pKa = 3.2TLQAAGDD201 pKa = 3.6VDD203 pKa = 4.73IILGLLAKK211 pKa = 10.37RR212 pKa = 11.84PGLSEE217 pKa = 4.28EE218 pKa = 4.31EE219 pKa = 3.89NTAIDD224 pKa = 3.85TVNNRR229 pKa = 11.84LLTEE233 pKa = 4.05ATEE236 pKa = 4.19KK237 pKa = 11.02GVVVLDD243 pKa = 3.88FMEE246 pKa = 4.21WTISGEE252 pKa = 4.15NVDD255 pKa = 5.88PITQDD260 pKa = 3.05VTIGDD265 pKa = 3.84VVVEE269 pKa = 4.15YY270 pKa = 11.06GSVASISDD278 pKa = 3.48MSTEE282 pKa = 4.2GDD284 pKa = 3.53GAYY287 pKa = 8.29CTYY290 pKa = 10.97EE291 pKa = 4.12GLCPLDD297 pKa = 3.35SHH299 pKa = 6.69AFSYY303 pKa = 10.47LAEE306 pKa = 5.25DD307 pKa = 3.95GRR309 pKa = 11.84HH310 pKa = 6.15LNTLMQGMLANEE322 pKa = 4.7ILTAMNTHH330 pKa = 6.91FDD332 pKa = 3.43HH333 pKa = 7.98DD334 pKa = 4.19IDD336 pKa = 4.54LLSDD340 pKa = 3.85SEE342 pKa = 4.41LLGLVGVSEE351 pKa = 4.74VPVPAAAWLFMSALLGLVGIKK372 pKa = 9.89RR373 pKa = 11.84RR374 pKa = 11.84NN375 pKa = 3.13
MM1 pKa = 7.3TSNPILLAAFSLALAQPALSQVNMALLGDD30 pKa = 4.62SIIDD34 pKa = 4.16DD35 pKa = 3.88YY36 pKa = 11.65LGPSNSIGTNTNLAAGSFGQILADD60 pKa = 3.73TRR62 pKa = 11.84GADD65 pKa = 3.52INFGAYY71 pKa = 8.51KK72 pKa = 10.64APTANTADD80 pKa = 3.28AWDD83 pKa = 4.11SIRR86 pKa = 11.84NFGYY90 pKa = 10.05EE91 pKa = 4.36YY92 pKa = 11.14NWATAGGTASAQEE105 pKa = 4.29LNLDD109 pKa = 4.02FNGPDD114 pKa = 3.23APGYY118 pKa = 9.49AQIPIASNLAAQVAGLAPSISSGDD142 pKa = 3.0VDD144 pKa = 3.63TAVISVGPNDD154 pKa = 4.02FFYY157 pKa = 10.99HH158 pKa = 5.98SLVIDD163 pKa = 3.72TASGGFYY170 pKa = 9.43PAPDD174 pKa = 3.7GQLDD178 pKa = 3.53QTFTNLVADD187 pKa = 5.14SILEE191 pKa = 4.85GIDD194 pKa = 3.2TLQAAGDD201 pKa = 3.6VDD203 pKa = 4.73IILGLLAKK211 pKa = 10.37RR212 pKa = 11.84PGLSEE217 pKa = 4.28EE218 pKa = 4.31EE219 pKa = 3.89NTAIDD224 pKa = 3.85TVNNRR229 pKa = 11.84LLTEE233 pKa = 4.05ATEE236 pKa = 4.19KK237 pKa = 11.02GVVVLDD243 pKa = 3.88FMEE246 pKa = 4.21WTISGEE252 pKa = 4.15NVDD255 pKa = 5.88PITQDD260 pKa = 3.05VTIGDD265 pKa = 3.84VVVEE269 pKa = 4.15YY270 pKa = 11.06GSVASISDD278 pKa = 3.48MSTEE282 pKa = 4.2GDD284 pKa = 3.53GAYY287 pKa = 8.29CTYY290 pKa = 10.97EE291 pKa = 4.12GLCPLDD297 pKa = 3.35SHH299 pKa = 6.69AFSYY303 pKa = 10.47LAEE306 pKa = 5.25DD307 pKa = 3.95GRR309 pKa = 11.84HH310 pKa = 6.15LNTLMQGMLANEE322 pKa = 4.7ILTAMNTHH330 pKa = 6.91FDD332 pKa = 3.43HH333 pKa = 7.98DD334 pKa = 4.19IDD336 pKa = 4.54LLSDD340 pKa = 3.85SEE342 pKa = 4.41LLGLVGVSEE351 pKa = 4.74VPVPAAAWLFMSALLGLVGIKK372 pKa = 9.89RR373 pKa = 11.84RR374 pKa = 11.84NN375 pKa = 3.13
Molecular weight: 39.37 kDa
Isoelectric point according different methods:
Protein with the highest isoelectric point:
>tr|A0A1X9NGP8|A0A1X9NGP8_9GAMM Selenide water dikinase SelD OS=Oceanicoccus sagamiensis OX=716816 GN=BST96_20065 PE=4 SV=1
MM1 pKa = 7.45KK2 pKa = 9.51RR3 pKa = 11.84TFQPSVLKK11 pKa = 10.49RR12 pKa = 11.84KK13 pKa = 7.97RR14 pKa = 11.84THH16 pKa = 5.89GFRR19 pKa = 11.84ARR21 pKa = 11.84MATKK25 pKa = 10.43NGRR28 pKa = 11.84ALINRR33 pKa = 11.84RR34 pKa = 11.84RR35 pKa = 11.84AKK37 pKa = 9.77GRR39 pKa = 11.84KK40 pKa = 8.85RR41 pKa = 11.84LSAA44 pKa = 3.96
MM1 pKa = 7.45KK2 pKa = 9.51RR3 pKa = 11.84TFQPSVLKK11 pKa = 10.49RR12 pKa = 11.84KK13 pKa = 7.97RR14 pKa = 11.84THH16 pKa = 5.89GFRR19 pKa = 11.84ARR21 pKa = 11.84MATKK25 pKa = 10.43NGRR28 pKa = 11.84ALINRR33 pKa = 11.84RR34 pKa = 11.84RR35 pKa = 11.84AKK37 pKa = 9.77GRR39 pKa = 11.84KK40 pKa = 8.85RR41 pKa = 11.84LSAA44 pKa = 3.96
Molecular weight: 5.21 kDa
Isoelectric point according different methods:
Peptides (in silico digests for buttom-up proteomics)
Below you can find in silico digests of the whole proteome with Trypsin, Chymotrypsin, Trypsin+LysC, LysN, ArgC proteases suitable for different mass spec machines.| Try ESI |
 |
|---|
| ChTry ESI |
|
|---|
| ArgC ESI |
|
|---|
| LysN ESI |
|
|---|
| TryLysC ESI |
|
|---|
| Try MALDI |
|
|---|
| ChTry MALDI |
|
|---|
| ArgC MALDI |
|
|---|
| LysN MALDI |
|
|---|
| TryLysC MALDI |
|
|---|
| Try LTQ |
|
|---|
| ChTry LTQ |
|
|---|
| ArgC LTQ |
|
|---|
| LysN LTQ |
|
|---|
| TryLysC LTQ |
|
|---|
| Try MSlow |
|
|---|
| ChTry MSlow |
|
|---|
| ArgC MSlow |
|
|---|
| LysN MSlow |
|
|---|
| TryLysC MSlow |
|
|---|
| Try MShigh |
|
|---|
| ChTry MShigh |
|
|---|
| ArgC MShigh |
|
|---|
| LysN MShigh |
|
|---|
| TryLysC MShigh |
|
|---|
General Statistics
Number of major isoforms |
Number of additional isoforms |
Number of all proteins |
Number of amino acids |
Min. Seq. Length |
Max. Seq. Length |
Avg. Seq. Length |
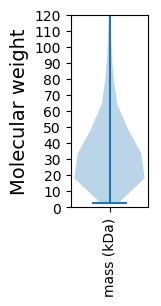
Avg. Mol. Weight |
|---|---|---|---|---|---|---|---|
0 |
1275952 |
25 |
14664 |
329.7 |
36.34 |
Amino acid frequency
Ala |
Cys |
Asp |
Glu |
Phe |
Gly |
His |
Ile |
Lys |
Leu |
|---|---|---|---|---|---|---|---|---|---|
9.43 ± 0.048 | 0.965 ± 0.017 |
6.162 ± 0.068 | 6.139 ± 0.044 |
3.891 ± 0.028 | 7.326 ± 0.065 |
2.007 ± 0.026 | 6.225 ± 0.035 |
4.517 ± 0.053 | 10.04 ± 0.054 |
Met |
Asn |
Gln |
Pro |
Arg |
Ser |
Thr |
Val |
Trp |
Tyr |
|---|---|---|---|---|---|---|---|---|---|
2.516 ± 0.027 | 4.114 ± 0.047 |
4.175 ± 0.038 | 4.571 ± 0.039 |
4.627 ± 0.05 | 6.679 ± 0.039 |
5.445 ± 0.063 | 6.839 ± 0.036 |
1.245 ± 0.018 | 3.086 ± 0.029 |
Most of the basic statistics you can see at this page can be downloaded from this CSV file
See this proteome in:

Proteome-pI is available under Creative Commons Attribution-NoDerivs license, for more details see here
| Reference: Kozlowski LP. Proteome-pI 2.0: Proteome Isoelectric Point Database Update. Nucleic Acids Res. 2021, doi: 10.1093/nar/gkab944 | Contact: Lukasz P. Kozlowski |