Streptococcus satellite phage Javan70
Taxonomy: Viruses; unclassified bacterial viruses
Average proteome isoelectric point is 6.6
Get precalculated fractions of proteins
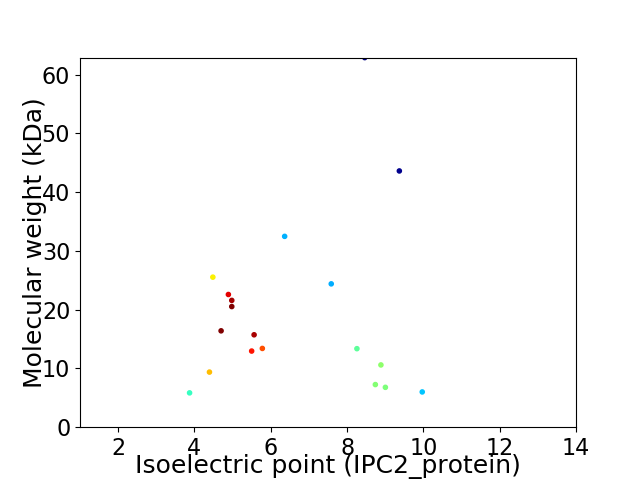
Virtual 2D-PAGE plot for 19 proteins (isoelectric point calculated using IPC2_protein)
Get csv file with sequences according to given criteria:
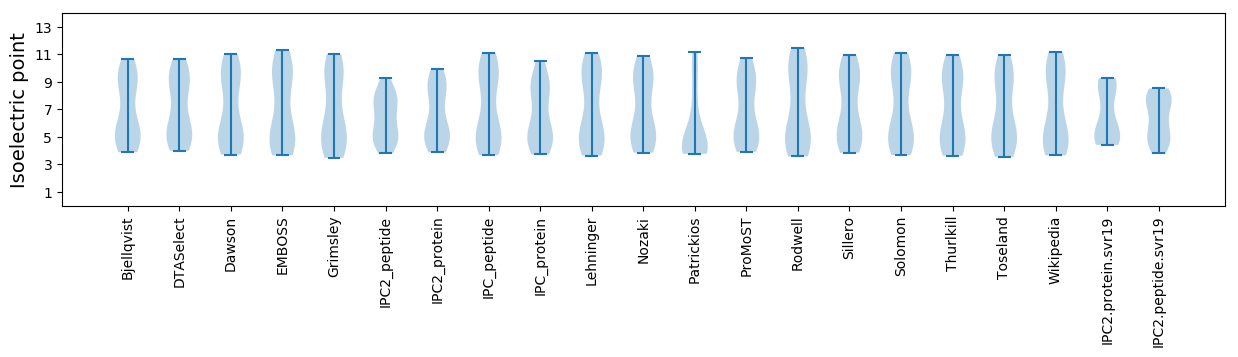
* You can choose from 21 different methods for calculating isoelectric point
Summary statistics related to proteome-wise predictions
Protein with the lowest isoelectric point:
>tr|A0A4D5ZUD9|A0A4D5ZUD9_9VIRU HTH cro/C1-type domain-containing protein OS=Streptococcus satellite phage Javan70 OX=2558811 GN=JavanS70_0018 PE=4 SV=1
MM1 pKa = 7.74IDD3 pKa = 5.03DD4 pKa = 6.14IIPEE8 pKa = 4.39LNDD11 pKa = 3.62LQTLATVALVDD22 pKa = 4.68DD23 pKa = 4.85NLNTSQAVLRR33 pKa = 11.84VIEE36 pKa = 4.06QKK38 pKa = 10.11IPRR41 pKa = 11.84LIEE44 pKa = 3.73ILEE47 pKa = 4.05EE48 pKa = 4.31LEE50 pKa = 4.15NGG52 pKa = 3.7
MM1 pKa = 7.74IDD3 pKa = 5.03DD4 pKa = 6.14IIPEE8 pKa = 4.39LNDD11 pKa = 3.62LQTLATVALVDD22 pKa = 4.68DD23 pKa = 4.85NLNTSQAVLRR33 pKa = 11.84VIEE36 pKa = 4.06QKK38 pKa = 10.11IPRR41 pKa = 11.84LIEE44 pKa = 3.73ILEE47 pKa = 4.05EE48 pKa = 4.31LEE50 pKa = 4.15NGG52 pKa = 3.7
Molecular weight: 5.84 kDa
Isoelectric point according different methods:
Protein with the highest isoelectric point:
>tr|A0A4D5ZYM4|A0A4D5ZYM4_9VIRU HTH DNA-binding protein OS=Streptococcus satellite phage Javan70 OX=2558811 GN=JavanS70_0017 PE=4 SV=1
MM1 pKa = 7.27GRR3 pKa = 11.84YY4 pKa = 7.2NTHH7 pKa = 6.97PAQKK11 pKa = 9.85SGHH14 pKa = 4.57YY15 pKa = 10.21HH16 pKa = 5.5NEE18 pKa = 3.06KK19 pKa = 9.84HH20 pKa = 6.12YY21 pKa = 10.81KK22 pKa = 9.61DD23 pKa = 3.59RR24 pKa = 11.84RR25 pKa = 11.84PTLEE29 pKa = 3.63QQEE32 pKa = 4.28EE33 pKa = 4.17QKK35 pKa = 10.79RR36 pKa = 11.84LKK38 pKa = 10.26KK39 pKa = 10.33LKK41 pKa = 9.56KK42 pKa = 9.5KK43 pKa = 9.73RR44 pKa = 11.84RR45 pKa = 11.84KK46 pKa = 9.75GRR48 pKa = 3.39
MM1 pKa = 7.27GRR3 pKa = 11.84YY4 pKa = 7.2NTHH7 pKa = 6.97PAQKK11 pKa = 9.85SGHH14 pKa = 4.57YY15 pKa = 10.21HH16 pKa = 5.5NEE18 pKa = 3.06KK19 pKa = 9.84HH20 pKa = 6.12YY21 pKa = 10.81KK22 pKa = 9.61DD23 pKa = 3.59RR24 pKa = 11.84RR25 pKa = 11.84PTLEE29 pKa = 3.63QQEE32 pKa = 4.28EE33 pKa = 4.17QKK35 pKa = 10.79RR36 pKa = 11.84LKK38 pKa = 10.26KK39 pKa = 10.33LKK41 pKa = 9.56KK42 pKa = 9.5KK43 pKa = 9.73RR44 pKa = 11.84RR45 pKa = 11.84KK46 pKa = 9.75GRR48 pKa = 3.39
Molecular weight: 6.0 kDa
Isoelectric point according different methods:
Peptides (in silico digests for buttom-up proteomics)
Below you can find in silico digests of the whole proteome with Trypsin, Chymotrypsin, Trypsin+LysC, LysN, ArgC proteases suitable for different mass spec machines.| Try ESI |
 |
|---|
| ChTry ESI |
|
|---|
| ArgC ESI |
|
|---|
| LysN ESI |
|
|---|
| TryLysC ESI |
|
|---|
| Try MALDI |
|
|---|
| ChTry MALDI |
|
|---|
| ArgC MALDI |
|
|---|
| LysN MALDI |
|
|---|
| TryLysC MALDI |
|
|---|
| Try LTQ |
|
|---|
| ChTry LTQ |
|
|---|
| ArgC LTQ |
|
|---|
| LysN LTQ |
|
|---|
| TryLysC LTQ |
|
|---|
| Try MSlow |
|
|---|
| ChTry MSlow |
|
|---|
| ArgC MSlow |
|
|---|
| LysN MSlow |
|
|---|
| TryLysC MSlow |
|
|---|
| Try MShigh |
|
|---|
| ChTry MShigh |
|
|---|
| ArgC MShigh |
|
|---|
| LysN MShigh |
|
|---|
| TryLysC MShigh |
|
|---|
General Statistics
Number of major isoforms |
Number of additional isoforms |
Number of all proteins |
Number of amino acids |
Min. Seq. Length |
Max. Seq. Length |
Avg. Seq. Length |
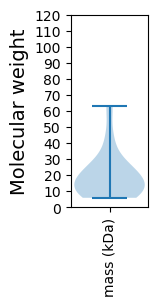
Avg. Mol. Weight |
|---|---|---|---|---|---|---|---|
0 |
3194 |
48 |
545 |
168.1 |
19.54 |
Amino acid frequency
Ala |
Cys |
Asp |
Glu |
Phe |
Gly |
His |
Ile |
Lys |
Leu |
|---|---|---|---|---|---|---|---|---|---|
6.199 ± 0.438 | 0.532 ± 0.141 |
5.51 ± 0.53 | 9.737 ± 0.85 |
3.663 ± 0.286 | 4.195 ± 0.508 |
1.597 ± 0.263 | 7.483 ± 0.595 |
9.424 ± 0.502 | 10.238 ± 0.566 |
Met |
Asn |
Gln |
Pro |
Arg |
Ser |
Thr |
Val |
Trp |
Tyr |
|---|---|---|---|---|---|---|---|---|---|
2.379 ± 0.258 | 4.79 ± 0.375 |
3.225 ± 0.431 | 4.728 ± 0.362 |
5.291 ± 0.487 | 4.508 ± 0.29 |
6.356 ± 0.458 | 4.696 ± 0.476 |
0.971 ± 0.115 | 4.477 ± 0.236 |
Most of the basic statistics you can see at this page can be downloaded from this CSV file
See this proteome in:

Proteome-pI is available under Creative Commons Attribution-NoDerivs license, for more details see here
| Reference: Kozlowski LP. Proteome-pI 2.0: Proteome Isoelectric Point Database Update. Nucleic Acids Res. 2021, doi: 10.1093/nar/gkab944 | Contact: Lukasz P. Kozlowski |