Morganella morganii (Proteus morganii)
Taxonomy: cellular organisms; Bacteria; Proteobacteria; Gammaproteobacteria; Enterobacterales; Morganellaceae; Morganella
Average proteome isoelectric point is 6.62
Get precalculated fractions of proteins
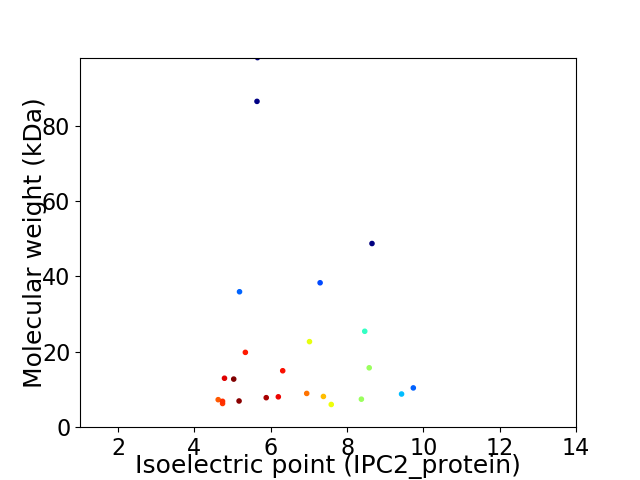
Virtual 2D-PAGE plot for 24 proteins (isoelectric point calculated using IPC2_protein)
Get csv file with sequences according to given criteria:
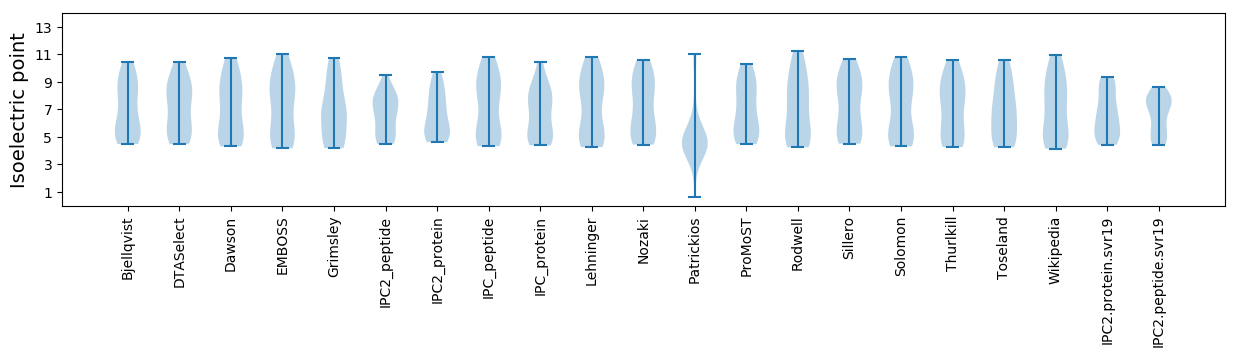
* You can choose from 21 different methods for calculating isoelectric point
Summary statistics related to proteome-wise predictions
Protein with the lowest isoelectric point:
>tr|A0A1W6JPE9|A0A1W6JPE9_MORMO Uncharacterized protein OS=Morganella morganii OX=582 PE=4 SV=1
MM1 pKa = 7.96RR2 pKa = 11.84DD3 pKa = 3.62YY4 pKa = 10.69PVSSLVTEE12 pKa = 4.32SMTNGSSVSGFIPEE26 pKa = 4.31LSIINALYY34 pKa = 10.23YY35 pKa = 9.77PQSQQPAGDD44 pKa = 3.97LCAHH48 pKa = 6.27TEE50 pKa = 4.1KK51 pKa = 10.61QSPSQPQQ58 pKa = 2.77
MM1 pKa = 7.96RR2 pKa = 11.84DD3 pKa = 3.62YY4 pKa = 10.69PVSSLVTEE12 pKa = 4.32SMTNGSSVSGFIPEE26 pKa = 4.31LSIINALYY34 pKa = 10.23YY35 pKa = 9.77PQSQQPAGDD44 pKa = 3.97LCAHH48 pKa = 6.27TEE50 pKa = 4.1KK51 pKa = 10.61QSPSQPQQ58 pKa = 2.77
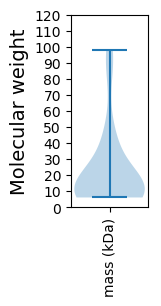
Molecular weight: 6.29 kDa
Isoelectric point according different methods:
Protein with the highest isoelectric point:
>tr|A0A0A2R831|A0A0A2R831_MORMO Uncharacterized protein OS=Morganella morganii OX=582 GN=LR61_14145 PE=4 SV=1
MM1 pKa = 6.92RR2 pKa = 11.84TYY4 pKa = 11.06RR5 pKa = 11.84KK6 pKa = 7.45TKK8 pKa = 10.01PITATVTGTVTKK20 pKa = 9.92PPQRR24 pKa = 11.84VRR26 pKa = 11.84TATGKK31 pKa = 10.59VMATMTIQAEE41 pKa = 4.31SEE43 pKa = 4.08RR44 pKa = 11.84RR45 pKa = 11.84SPYY48 pKa = 9.45PLKK51 pKa = 10.87LVAFDD56 pKa = 3.95MNALEE61 pKa = 6.03LMTCQRR67 pKa = 11.84GSRR70 pKa = 11.84VIATGRR76 pKa = 11.84HH77 pKa = 4.31EE78 pKa = 4.38WFNGYY83 pKa = 8.47QLTGAQIVTCC93 pKa = 4.78
MM1 pKa = 6.92RR2 pKa = 11.84TYY4 pKa = 11.06RR5 pKa = 11.84KK6 pKa = 7.45TKK8 pKa = 10.01PITATVTGTVTKK20 pKa = 9.92PPQRR24 pKa = 11.84VRR26 pKa = 11.84TATGKK31 pKa = 10.59VMATMTIQAEE41 pKa = 4.31SEE43 pKa = 4.08RR44 pKa = 11.84RR45 pKa = 11.84SPYY48 pKa = 9.45PLKK51 pKa = 10.87LVAFDD56 pKa = 3.95MNALEE61 pKa = 6.03LMTCQRR67 pKa = 11.84GSRR70 pKa = 11.84VIATGRR76 pKa = 11.84HH77 pKa = 4.31EE78 pKa = 4.38WFNGYY83 pKa = 8.47QLTGAQIVTCC93 pKa = 4.78
Molecular weight: 10.42 kDa
Isoelectric point according different methods:
Peptides (in silico digests for buttom-up proteomics)
Below you can find in silico digests of the whole proteome with Trypsin, Chymotrypsin, Trypsin+LysC, LysN, ArgC proteases suitable for different mass spec machines.| Try ESI |
 |
|---|
| ChTry ESI |
|
|---|
| ArgC ESI |
|
|---|
| LysN ESI |
|
|---|
| TryLysC ESI |
|
|---|
| Try MALDI |
|
|---|
| ChTry MALDI |
|
|---|
| ArgC MALDI |
|
|---|
| LysN MALDI |
|
|---|
| TryLysC MALDI |
|
|---|
| Try LTQ |
|
|---|
| ChTry LTQ |
|
|---|
| ArgC LTQ |
|
|---|
| LysN LTQ |
|
|---|
| TryLysC LTQ |
|
|---|
| Try MSlow |
|
|---|
| ChTry MSlow |
|
|---|
| ArgC MSlow |
|
|---|
| LysN MSlow |
|
|---|
| TryLysC MSlow |
|
|---|
| Try MShigh |
|
|---|
| ChTry MShigh |
|
|---|
| ArgC MShigh |
|
|---|
| LysN MShigh |
|
|---|
| TryLysC MShigh |
|
|---|
General Statistics
Number of major isoforms |
Number of additional isoforms |
Number of all proteins |
Number of amino acids |
Min. Seq. Length |
Max. Seq. Length |
Avg. Seq. Length |
Avg. Mol. Weight |
|---|---|---|---|---|---|---|---|
0 |
4746 |
56 |
904 |
197.8 |
21.87 |
Amino acid frequency
Ala |
Cys |
Asp |
Glu |
Phe |
Gly |
His |
Ile |
Lys |
Leu |
|---|---|---|---|---|---|---|---|---|---|
9.84 ± 0.577 | 1.138 ± 0.247 |
6.089 ± 0.276 | 5.921 ± 0.422 |
3.055 ± 0.312 | 7.29 ± 0.69 |
1.749 ± 0.283 | 6.511 ± 0.426 |
6.321 ± 0.406 | 8.365 ± 0.492 |
Met |
Asn |
Gln |
Pro |
Arg |
Ser |
Thr |
Val |
Trp |
Tyr |
|---|---|---|---|---|---|---|---|---|---|
2.781 ± 0.273 | 5.162 ± 0.617 |
3.708 ± 0.331 | 4.193 ± 0.387 |
5.626 ± 0.674 | 6.679 ± 0.462 |
5.563 ± 0.423 | 5.794 ± 0.268 |
1.433 ± 0.181 | 2.781 ± 0.16 |
Most of the basic statistics you can see at this page can be downloaded from this CSV file
See this proteome in:

Proteome-pI is available under Creative Commons Attribution-NoDerivs license, for more details see here
| Reference: Kozlowski LP. Proteome-pI 2.0: Proteome Isoelectric Point Database Update. Nucleic Acids Res. 2021, doi: 10.1093/nar/gkab944 | Contact: Lukasz P. Kozlowski |