Blackcurrant leafroll-associated virus 1
Taxonomy: Viruses; Riboviria; Orthornavirae; Kitrinoviricota; Alsuviricetes; Martellivirales; Closteroviridae; Closterovirus; unclassified Closterovirus
Average proteome isoelectric point is 6.26
Get precalculated fractions of proteins
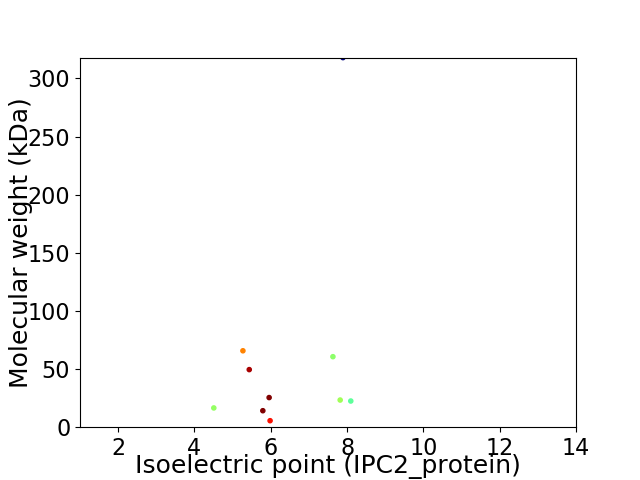
Virtual 2D-PAGE plot for 10 proteins (isoelectric point calculated using IPC2_protein)
Get csv file with sequences according to given criteria:
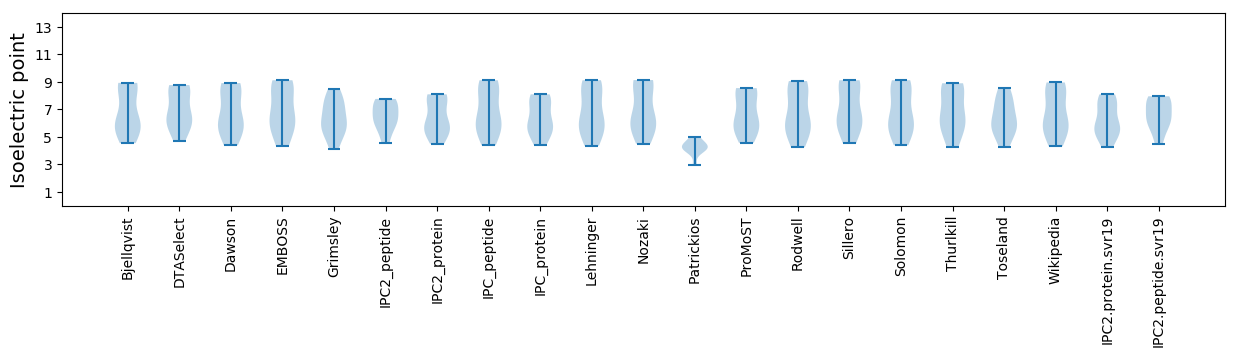
* You can choose from 21 different methods for calculating isoelectric point
Summary statistics related to proteome-wise predictions
Protein with the lowest isoelectric point:
>tr|A0A346FH38|A0A346FH38_9CLOS P14 OS=Blackcurrant leafroll-associated virus 1 OX=2292426 PE=4 SV=1
MM1 pKa = 7.41AAGVRR6 pKa = 11.84KK7 pKa = 8.09TPIIFIDD14 pKa = 4.62ISTSWIGYY22 pKa = 8.69RR23 pKa = 11.84DD24 pKa = 3.67CLINCDD30 pKa = 3.38HH31 pKa = 6.96MIIADD36 pKa = 5.38CEE38 pKa = 4.42YY39 pKa = 10.43EE40 pKa = 4.25WNCIDD45 pKa = 3.77GDD47 pKa = 4.01CWEE50 pKa = 4.91SPTASVVEE58 pKa = 4.74FFDD61 pKa = 4.85SCIEE65 pKa = 4.12DD66 pKa = 3.51PGVQVVNVSRR76 pKa = 11.84NDD78 pKa = 4.05LISSKK83 pKa = 10.99VIVEE87 pKa = 4.09YY88 pKa = 10.35TSTFTIYY95 pKa = 10.21HH96 pKa = 5.74GSDD99 pKa = 2.61RR100 pKa = 11.84RR101 pKa = 11.84TVVTFDD107 pKa = 3.11STPVVNRR114 pKa = 11.84SMIYY118 pKa = 9.12TEE120 pKa = 4.18SSPVLSLVNILKK132 pKa = 8.95TLDD135 pKa = 3.16SWKK138 pKa = 10.17LKK140 pKa = 10.05QVTVVNLL147 pKa = 3.41
MM1 pKa = 7.41AAGVRR6 pKa = 11.84KK7 pKa = 8.09TPIIFIDD14 pKa = 4.62ISTSWIGYY22 pKa = 8.69RR23 pKa = 11.84DD24 pKa = 3.67CLINCDD30 pKa = 3.38HH31 pKa = 6.96MIIADD36 pKa = 5.38CEE38 pKa = 4.42YY39 pKa = 10.43EE40 pKa = 4.25WNCIDD45 pKa = 3.77GDD47 pKa = 4.01CWEE50 pKa = 4.91SPTASVVEE58 pKa = 4.74FFDD61 pKa = 4.85SCIEE65 pKa = 4.12DD66 pKa = 3.51PGVQVVNVSRR76 pKa = 11.84NDD78 pKa = 4.05LISSKK83 pKa = 10.99VIVEE87 pKa = 4.09YY88 pKa = 10.35TSTFTIYY95 pKa = 10.21HH96 pKa = 5.74GSDD99 pKa = 2.61RR100 pKa = 11.84RR101 pKa = 11.84TVVTFDD107 pKa = 3.11STPVVNRR114 pKa = 11.84SMIYY118 pKa = 9.12TEE120 pKa = 4.18SSPVLSLVNILKK132 pKa = 8.95TLDD135 pKa = 3.16SWKK138 pKa = 10.17LKK140 pKa = 10.05QVTVVNLL147 pKa = 3.41
Molecular weight: 16.57 kDa
Isoelectric point according different methods:
Protein with the highest isoelectric point:
>tr|A0A346FH37|A0A346FH37_9CLOS P17 OS=Blackcurrant leafroll-associated virus 1 OX=2292426 PE=4 SV=1
MM1 pKa = 7.18STGKK5 pKa = 9.79PPLTLRR11 pKa = 11.84DD12 pKa = 3.42ISRR15 pKa = 11.84VSIKK19 pKa = 10.32LDD21 pKa = 3.21KK22 pKa = 10.65EE23 pKa = 4.09LNEE26 pKa = 4.08VEE28 pKa = 4.38KK29 pKa = 10.26TVVLAGLVKK38 pKa = 10.29IFAEE42 pKa = 4.85EE43 pKa = 4.08YY44 pKa = 9.67KK45 pKa = 11.02FPVEE49 pKa = 4.83DD50 pKa = 3.62INMHH54 pKa = 6.01VYY56 pKa = 10.21MIMPLLNRR64 pKa = 11.84VSTSDD69 pKa = 3.63KK70 pKa = 10.77VVASQAGSGITYY82 pKa = 9.02TLGDD86 pKa = 3.42KK87 pKa = 10.44EE88 pKa = 4.26YY89 pKa = 10.21TIKK92 pKa = 10.92EE93 pKa = 4.42DD94 pKa = 3.29ILEE97 pKa = 4.87KK98 pKa = 10.3ISQLVPRR105 pKa = 11.84TGKK108 pKa = 10.33NNLRR112 pKa = 11.84LWARR116 pKa = 11.84TCEE119 pKa = 4.04KK120 pKa = 10.71VYY122 pKa = 10.98LDD124 pKa = 3.77VAFAQPDD131 pKa = 3.61LFKK134 pKa = 11.06CEE136 pKa = 3.58RR137 pKa = 11.84SLRR140 pKa = 11.84ANAPIGFAWAAADD153 pKa = 3.94FLPGVDD159 pKa = 4.55RR160 pKa = 11.84RR161 pKa = 11.84LTDD164 pKa = 3.11EE165 pKa = 3.72MRR167 pKa = 11.84AAIVSCRR174 pKa = 11.84KK175 pKa = 7.67TLLRR179 pKa = 11.84RR180 pKa = 11.84SKK182 pKa = 10.48EE183 pKa = 3.75VSEE186 pKa = 4.69TGNQLITLEE195 pKa = 4.2KK196 pKa = 10.59LGVASS201 pKa = 4.17
MM1 pKa = 7.18STGKK5 pKa = 9.79PPLTLRR11 pKa = 11.84DD12 pKa = 3.42ISRR15 pKa = 11.84VSIKK19 pKa = 10.32LDD21 pKa = 3.21KK22 pKa = 10.65EE23 pKa = 4.09LNEE26 pKa = 4.08VEE28 pKa = 4.38KK29 pKa = 10.26TVVLAGLVKK38 pKa = 10.29IFAEE42 pKa = 4.85EE43 pKa = 4.08YY44 pKa = 9.67KK45 pKa = 11.02FPVEE49 pKa = 4.83DD50 pKa = 3.62INMHH54 pKa = 6.01VYY56 pKa = 10.21MIMPLLNRR64 pKa = 11.84VSTSDD69 pKa = 3.63KK70 pKa = 10.77VVASQAGSGITYY82 pKa = 9.02TLGDD86 pKa = 3.42KK87 pKa = 10.44EE88 pKa = 4.26YY89 pKa = 10.21TIKK92 pKa = 10.92EE93 pKa = 4.42DD94 pKa = 3.29ILEE97 pKa = 4.87KK98 pKa = 10.3ISQLVPRR105 pKa = 11.84TGKK108 pKa = 10.33NNLRR112 pKa = 11.84LWARR116 pKa = 11.84TCEE119 pKa = 4.04KK120 pKa = 10.71VYY122 pKa = 10.98LDD124 pKa = 3.77VAFAQPDD131 pKa = 3.61LFKK134 pKa = 11.06CEE136 pKa = 3.58RR137 pKa = 11.84SLRR140 pKa = 11.84ANAPIGFAWAAADD153 pKa = 3.94FLPGVDD159 pKa = 4.55RR160 pKa = 11.84RR161 pKa = 11.84LTDD164 pKa = 3.11EE165 pKa = 3.72MRR167 pKa = 11.84AAIVSCRR174 pKa = 11.84KK175 pKa = 7.67TLLRR179 pKa = 11.84RR180 pKa = 11.84SKK182 pKa = 10.48EE183 pKa = 3.75VSEE186 pKa = 4.69TGNQLITLEE195 pKa = 4.2KK196 pKa = 10.59LGVASS201 pKa = 4.17
Molecular weight: 22.52 kDa
Isoelectric point according different methods:
Peptides (in silico digests for buttom-up proteomics)
Below you can find in silico digests of the whole proteome with Trypsin, Chymotrypsin, Trypsin+LysC, LysN, ArgC proteases suitable for different mass spec machines.| Try ESI |
 |
|---|
| ChTry ESI |
|
|---|
| ArgC ESI |
|
|---|
| LysN ESI |
|
|---|
| TryLysC ESI |
|
|---|
| Try MALDI |
|
|---|
| ChTry MALDI |
|
|---|
| ArgC MALDI |
|
|---|
| LysN MALDI |
|
|---|
| TryLysC MALDI |
|
|---|
| Try LTQ |
|
|---|
| ChTry LTQ |
|
|---|
| ArgC LTQ |
|
|---|
| LysN LTQ |
|
|---|
| TryLysC LTQ |
|
|---|
| Try MSlow |
|
|---|
| ChTry MSlow |
|
|---|
| ArgC MSlow |
|
|---|
| LysN MSlow |
|
|---|
| TryLysC MSlow |
|
|---|
| Try MShigh |
|
|---|
| ChTry MShigh |
|
|---|
| ArgC MShigh |
|
|---|
| LysN MShigh |
|
|---|
| TryLysC MShigh |
|
|---|
General Statistics
Number of major isoforms |
Number of additional isoforms |
Number of all proteins |
Number of amino acids |
Min. Seq. Length |
Max. Seq. Length |
Avg. Seq. Length |
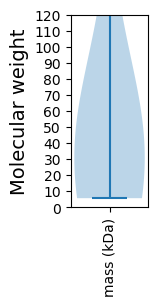
Avg. Mol. Weight |
|---|---|---|---|---|---|---|---|
0 |
5356 |
49 |
2839 |
535.6 |
60.16 |
Amino acid frequency
Ala |
Cys |
Asp |
Glu |
Phe |
Gly |
His |
Ile |
Lys |
Leu |
|---|---|---|---|---|---|---|---|---|---|
5.676 ± 0.304 | 2.707 ± 0.408 |
6.255 ± 0.356 | 5.377 ± 0.466 |
5.825 ± 0.435 | 5.583 ± 0.386 |
1.848 ± 0.289 | 5.639 ± 0.356 |
6.311 ± 0.332 | 9.727 ± 0.284 |
Met |
Asn |
Gln |
Pro |
Arg |
Ser |
Thr |
Val |
Trp |
Tyr |
|---|---|---|---|---|---|---|---|---|---|
1.755 ± 0.166 | 4.238 ± 0.348 |
3.734 ± 0.244 | 2.315 ± 0.156 |
5.956 ± 0.275 | 9.989 ± 1.052 |
4.985 ± 0.335 | 7.935 ± 0.285 |
0.635 ± 0.194 | 3.51 ± 0.154 |
Most of the basic statistics you can see at this page can be downloaded from this CSV file
See this proteome in:

Proteome-pI is available under Creative Commons Attribution-NoDerivs license, for more details see here
| Reference: Kozlowski LP. Proteome-pI 2.0: Proteome Isoelectric Point Database Update. Nucleic Acids Res. 2021, doi: 10.1093/nar/gkab944 | Contact: Lukasz P. Kozlowski |