Frondihabitans sp. Leaf304
Taxonomy: cellular organisms; Bacteria; Terrabacteria group; Actinobacteria; Actinomycetia; Micrococcales; Microbacteriaceae; Frondihabitans; unclassified Frondihabitans
Average proteome isoelectric point is 6.14
Get precalculated fractions of proteins
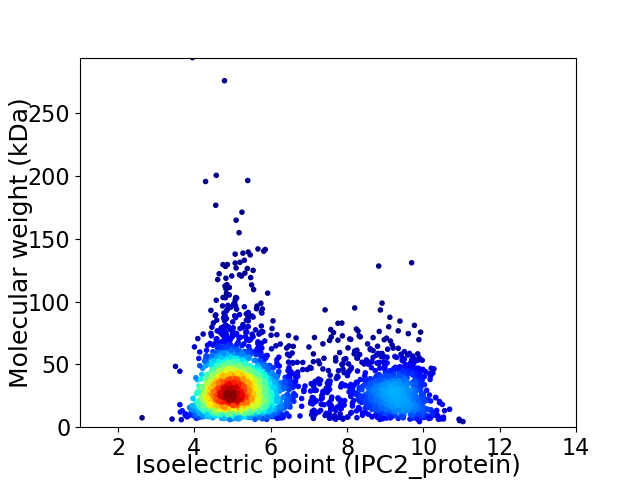
Virtual 2D-PAGE plot for 3039 proteins (isoelectric point calculated using IPC2_protein)
Get csv file with sequences according to given criteria:
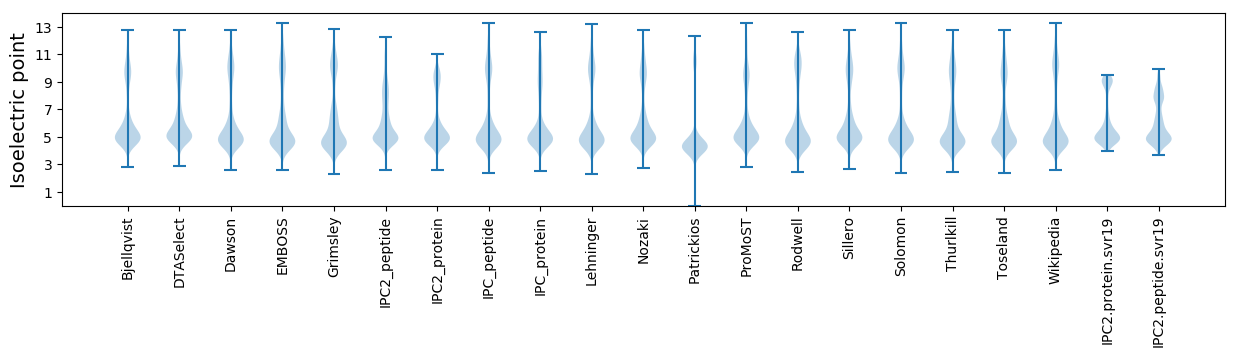
* You can choose from 21 different methods for calculating isoelectric point
Summary statistics related to proteome-wise predictions
Protein with the lowest isoelectric point:
>tr|A0A0Q5C9H5|A0A0Q5C9H5_9MICO DNA polymerase III subunit gamma/tau OS=Frondihabitans sp. Leaf304 OX=1736329 GN=ASF54_05370 PE=3 SV=1
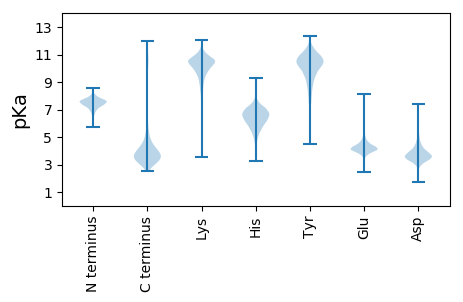
MM1 pKa = 7.64TSTSDD6 pKa = 3.17AQLVDD11 pKa = 3.67GFSVKK16 pKa = 7.8MTVPASFPAGEE27 pKa = 4.63AYY29 pKa = 10.42AEE31 pKa = 4.11IAGWDD36 pKa = 3.55YY37 pKa = 11.69SLCNDD42 pKa = 4.12NGSCASPSGSFIVSAGQQ59 pKa = 2.95
MM1 pKa = 7.64TSTSDD6 pKa = 3.17AQLVDD11 pKa = 3.67GFSVKK16 pKa = 7.8MTVPASFPAGEE27 pKa = 4.63AYY29 pKa = 10.42AEE31 pKa = 4.11IAGWDD36 pKa = 3.55YY37 pKa = 11.69SLCNDD42 pKa = 4.12NGSCASPSGSFIVSAGQQ59 pKa = 2.95
Molecular weight: 6.0 kDa
Isoelectric point according different methods:
Protein with the highest isoelectric point:
>tr|A0A0Q5CNV2|A0A0Q5CNV2_9MICO Amidase domain-containing protein OS=Frondihabitans sp. Leaf304 OX=1736329 GN=ASF54_10265 PE=4 SV=1
MM1 pKa = 7.63KK2 pKa = 10.23VRR4 pKa = 11.84NSLASLKK11 pKa = 9.97KK12 pKa = 10.49LPGAQVVRR20 pKa = 11.84RR21 pKa = 11.84RR22 pKa = 11.84GRR24 pKa = 11.84TFVINKK30 pKa = 8.63LNPRR34 pKa = 11.84GKK36 pKa = 10.33GRR38 pKa = 11.84QGG40 pKa = 2.91
MM1 pKa = 7.63KK2 pKa = 10.23VRR4 pKa = 11.84NSLASLKK11 pKa = 9.97KK12 pKa = 10.49LPGAQVVRR20 pKa = 11.84RR21 pKa = 11.84RR22 pKa = 11.84GRR24 pKa = 11.84TFVINKK30 pKa = 8.63LNPRR34 pKa = 11.84GKK36 pKa = 10.33GRR38 pKa = 11.84QGG40 pKa = 2.91
Molecular weight: 4.49 kDa
Isoelectric point according different methods:
Peptides (in silico digests for buttom-up proteomics)
Below you can find in silico digests of the whole proteome with Trypsin, Chymotrypsin, Trypsin+LysC, LysN, ArgC proteases suitable for different mass spec machines.| Try ESI |
 |
|---|
| ChTry ESI |
|
|---|
| ArgC ESI |
|
|---|
| LysN ESI |
|
|---|
| TryLysC ESI |
|
|---|
| Try MALDI |
|
|---|
| ChTry MALDI |
|
|---|
| ArgC MALDI |
|
|---|
| LysN MALDI |
|
|---|
| TryLysC MALDI |
|
|---|
| Try LTQ |
|
|---|
| ChTry LTQ |
|
|---|
| ArgC LTQ |
|
|---|
| LysN LTQ |
|
|---|
| TryLysC LTQ |
|
|---|
| Try MSlow |
|
|---|
| ChTry MSlow |
|
|---|
| ArgC MSlow |
|
|---|
| LysN MSlow |
|
|---|
| TryLysC MSlow |
|
|---|
| Try MShigh |
|
|---|
| ChTry MShigh |
|
|---|
| ArgC MShigh |
|
|---|
| LysN MShigh |
|
|---|
| TryLysC MShigh |
|
|---|
General Statistics
Number of major isoforms |
Number of additional isoforms |
Number of all proteins |
Number of amino acids |
Min. Seq. Length |
Max. Seq. Length |
Avg. Seq. Length |
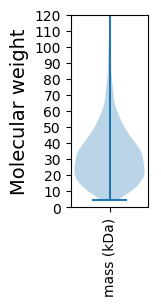
Avg. Mol. Weight |
|---|---|---|---|---|---|---|---|
0 |
971049 |
38 |
3048 |
319.5 |
34.06 |
Amino acid frequency
Ala |
Cys |
Asp |
Glu |
Phe |
Gly |
His |
Ile |
Lys |
Leu |
|---|---|---|---|---|---|---|---|---|---|
12.913 ± 0.062 | 0.439 ± 0.009 |
6.2 ± 0.041 | 5.201 ± 0.045 |
3.217 ± 0.025 | 8.911 ± 0.042 |
1.879 ± 0.02 | 4.534 ± 0.033 |
2.431 ± 0.039 | 10.107 ± 0.054 |
Met |
Asn |
Gln |
Pro |
Arg |
Ser |
Thr |
Val |
Trp |
Tyr |
|---|---|---|---|---|---|---|---|---|---|
1.617 ± 0.019 | 2.068 ± 0.027 |
5.216 ± 0.032 | 2.75 ± 0.023 |
6.783 ± 0.058 | 6.631 ± 0.041 |
6.63 ± 0.06 | 9.091 ± 0.045 |
1.379 ± 0.017 | 2.002 ± 0.019 |
Most of the basic statistics you can see at this page can be downloaded from this CSV file
See this proteome in:

Proteome-pI is available under Creative Commons Attribution-NoDerivs license, for more details see here
| Reference: Kozlowski LP. Proteome-pI 2.0: Proteome Isoelectric Point Database Update. Nucleic Acids Res. 2021, doi: 10.1093/nar/gkab944 | Contact: Lukasz P. Kozlowski |