Murine coronavirus repA59/RJHM
Taxonomy: Viruses; Riboviria; Orthornavirae; Pisuviricota; Pisoniviricetes; Nidovirales; Cornidovirineae; Coronaviridae; Orthocoronavirinae; Betacoronavirus; Embecovirus; Murine coronavirus; Murine hepatitis virus
Average proteome isoelectric point is 7.23
Get precalculated fractions of proteins
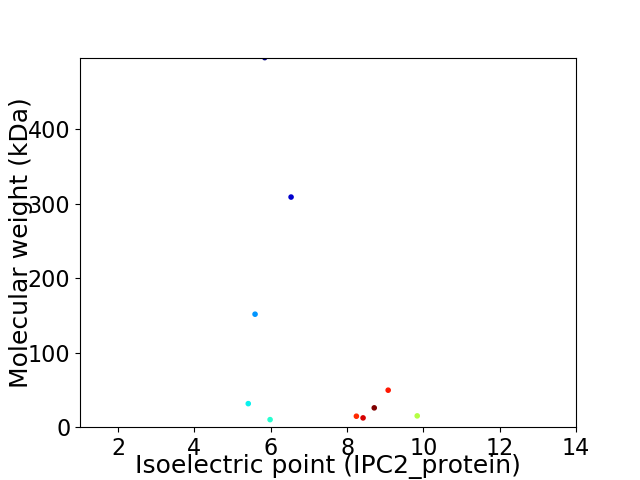
Virtual 2D-PAGE plot for 10 proteins (isoelectric point calculated using IPC2_protein)
Get csv file with sequences according to given criteria:
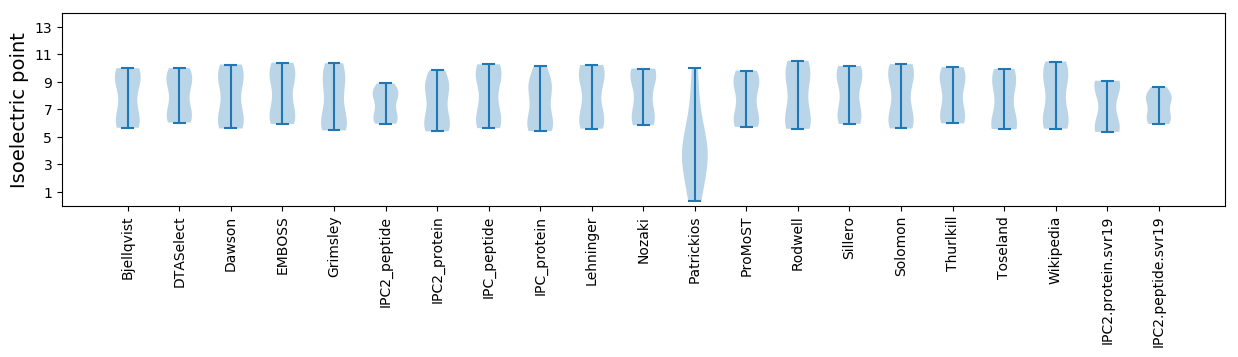
* You can choose from 21 different methods for calculating isoelectric point
Summary statistics related to proteome-wise predictions
Protein with the lowest isoelectric point:
>tr|C0KYU0|C0KYU0_9BETC Spike glycoprotein OS=Murine coronavirus repA59/RJHM OX=429331 GN=S PE=3 SV=1
MM1 pKa = 7.38SNKK4 pKa = 10.14SILVVAVKK12 pKa = 9.54MAFADD17 pKa = 4.0KK18 pKa = 10.12PNHH21 pKa = 6.87FINFPLAQFSGFMGKK36 pKa = 8.01YY37 pKa = 10.17LKK39 pKa = 10.62LQSQLVEE46 pKa = 4.08MGLDD50 pKa = 3.76CKK52 pKa = 10.5LQKK55 pKa = 10.45APHH58 pKa = 5.48VSITLLDD65 pKa = 3.72IKK67 pKa = 10.77ADD69 pKa = 3.42QYY71 pKa = 11.35KK72 pKa = 9.6QVEE75 pKa = 4.2FAIQEE80 pKa = 4.36IIDD83 pKa = 4.13DD84 pKa = 4.34LAAYY88 pKa = 9.61EE89 pKa = 4.09GDD91 pKa = 3.2IVFDD95 pKa = 3.88NPHH98 pKa = 5.62MLGRR102 pKa = 11.84CLVLDD107 pKa = 3.35VRR109 pKa = 11.84GFEE112 pKa = 4.33EE113 pKa = 3.94LHH115 pKa = 6.12EE116 pKa = 5.4DD117 pKa = 2.78IVEE120 pKa = 3.86ILRR123 pKa = 11.84RR124 pKa = 11.84RR125 pKa = 11.84GCTADD130 pKa = 4.2QSRR133 pKa = 11.84HH134 pKa = 5.63WIPHH138 pKa = 4.64CTVAQFDD145 pKa = 4.22EE146 pKa = 4.22EE147 pKa = 5.07RR148 pKa = 11.84EE149 pKa = 4.25TKK151 pKa = 10.47GMQFYY156 pKa = 10.52HH157 pKa = 7.09KK158 pKa = 10.33EE159 pKa = 3.82PFYY162 pKa = 11.1LKK164 pKa = 10.56HH165 pKa = 6.52NNLLTDD171 pKa = 3.99AGLEE175 pKa = 4.01LVKK178 pKa = 10.57IGSSKK183 pKa = 10.27IDD185 pKa = 3.21GFYY188 pKa = 10.77CSEE191 pKa = 3.98LSVWCGEE198 pKa = 4.13RR199 pKa = 11.84LCYY202 pKa = 10.09KK203 pKa = 10.34PPTPKK208 pKa = 10.32FSDD211 pKa = 2.77IFGYY215 pKa = 10.69CCIDD219 pKa = 4.15KK220 pKa = 10.66IRR222 pKa = 11.84GDD224 pKa = 4.16LEE226 pKa = 5.63IGDD229 pKa = 4.82LPQDD233 pKa = 4.71DD234 pKa = 4.12EE235 pKa = 4.54EE236 pKa = 5.09AWAEE240 pKa = 3.96LSYY243 pKa = 10.57HH244 pKa = 4.98YY245 pKa = 10.55QRR247 pKa = 11.84NTYY250 pKa = 9.02FFRR253 pKa = 11.84HH254 pKa = 4.59VHH256 pKa = 6.39DD257 pKa = 3.67NSIYY261 pKa = 9.71FRR263 pKa = 11.84TVCRR267 pKa = 11.84MKK269 pKa = 11.07GCMCC273 pKa = 5.37
MM1 pKa = 7.38SNKK4 pKa = 10.14SILVVAVKK12 pKa = 9.54MAFADD17 pKa = 4.0KK18 pKa = 10.12PNHH21 pKa = 6.87FINFPLAQFSGFMGKK36 pKa = 8.01YY37 pKa = 10.17LKK39 pKa = 10.62LQSQLVEE46 pKa = 4.08MGLDD50 pKa = 3.76CKK52 pKa = 10.5LQKK55 pKa = 10.45APHH58 pKa = 5.48VSITLLDD65 pKa = 3.72IKK67 pKa = 10.77ADD69 pKa = 3.42QYY71 pKa = 11.35KK72 pKa = 9.6QVEE75 pKa = 4.2FAIQEE80 pKa = 4.36IIDD83 pKa = 4.13DD84 pKa = 4.34LAAYY88 pKa = 9.61EE89 pKa = 4.09GDD91 pKa = 3.2IVFDD95 pKa = 3.88NPHH98 pKa = 5.62MLGRR102 pKa = 11.84CLVLDD107 pKa = 3.35VRR109 pKa = 11.84GFEE112 pKa = 4.33EE113 pKa = 3.94LHH115 pKa = 6.12EE116 pKa = 5.4DD117 pKa = 2.78IVEE120 pKa = 3.86ILRR123 pKa = 11.84RR124 pKa = 11.84RR125 pKa = 11.84GCTADD130 pKa = 4.2QSRR133 pKa = 11.84HH134 pKa = 5.63WIPHH138 pKa = 4.64CTVAQFDD145 pKa = 4.22EE146 pKa = 4.22EE147 pKa = 5.07RR148 pKa = 11.84EE149 pKa = 4.25TKK151 pKa = 10.47GMQFYY156 pKa = 10.52HH157 pKa = 7.09KK158 pKa = 10.33EE159 pKa = 3.82PFYY162 pKa = 11.1LKK164 pKa = 10.56HH165 pKa = 6.52NNLLTDD171 pKa = 3.99AGLEE175 pKa = 4.01LVKK178 pKa = 10.57IGSSKK183 pKa = 10.27IDD185 pKa = 3.21GFYY188 pKa = 10.77CSEE191 pKa = 3.98LSVWCGEE198 pKa = 4.13RR199 pKa = 11.84LCYY202 pKa = 10.09KK203 pKa = 10.34PPTPKK208 pKa = 10.32FSDD211 pKa = 2.77IFGYY215 pKa = 10.69CCIDD219 pKa = 4.15KK220 pKa = 10.66IRR222 pKa = 11.84GDD224 pKa = 4.16LEE226 pKa = 5.63IGDD229 pKa = 4.82LPQDD233 pKa = 4.71DD234 pKa = 4.12EE235 pKa = 4.54EE236 pKa = 5.09AWAEE240 pKa = 3.96LSYY243 pKa = 10.57HH244 pKa = 4.98YY245 pKa = 10.55QRR247 pKa = 11.84NTYY250 pKa = 9.02FFRR253 pKa = 11.84HH254 pKa = 4.59VHH256 pKa = 6.39DD257 pKa = 3.67NSIYY261 pKa = 9.71FRR263 pKa = 11.84TVCRR267 pKa = 11.84MKK269 pKa = 11.07GCMCC273 pKa = 5.37
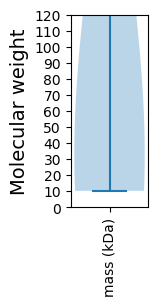
Molecular weight: 31.66 kDa
Isoelectric point according different methods:
Protein with the highest isoelectric point:
>tr|C0KYU2|C0KYU2_9BETC Non-structural protein ns5 OS=Murine coronavirus repA59/RJHM OX=429331 PE=4 SV=1
MM1 pKa = 7.46ALIGPKK7 pKa = 7.57TTIAAVFIGPFLVACMLGIGLVYY30 pKa = 10.81LLQLQVQIFHH40 pKa = 6.45VKK42 pKa = 9.07DD43 pKa = 3.89TIRR46 pKa = 11.84VTGKK50 pKa = 9.2PATVSYY56 pKa = 7.5TTSTPVTPVATTLDD70 pKa = 3.53GTTYY74 pKa = 10.5TLIRR78 pKa = 11.84PTSSYY83 pKa = 9.16TRR85 pKa = 11.84VYY87 pKa = 10.18LGSSRR92 pKa = 11.84GFDD95 pKa = 2.9TSTFGPKK102 pKa = 9.08TLDD105 pKa = 3.78YY106 pKa = 9.39ITSSKK111 pKa = 10.15PHH113 pKa = 6.34LNSGRR118 pKa = 11.84PYY120 pKa = 10.28TLRR123 pKa = 11.84HH124 pKa = 5.44LPKK127 pKa = 10.79YY128 pKa = 6.04MTPPATWRR136 pKa = 11.84FGLL139 pKa = 4.06
MM1 pKa = 7.46ALIGPKK7 pKa = 7.57TTIAAVFIGPFLVACMLGIGLVYY30 pKa = 10.81LLQLQVQIFHH40 pKa = 6.45VKK42 pKa = 9.07DD43 pKa = 3.89TIRR46 pKa = 11.84VTGKK50 pKa = 9.2PATVSYY56 pKa = 7.5TTSTPVTPVATTLDD70 pKa = 3.53GTTYY74 pKa = 10.5TLIRR78 pKa = 11.84PTSSYY83 pKa = 9.16TRR85 pKa = 11.84VYY87 pKa = 10.18LGSSRR92 pKa = 11.84GFDD95 pKa = 2.9TSTFGPKK102 pKa = 9.08TLDD105 pKa = 3.78YY106 pKa = 9.39ITSSKK111 pKa = 10.15PHH113 pKa = 6.34LNSGRR118 pKa = 11.84PYY120 pKa = 10.28TLRR123 pKa = 11.84HH124 pKa = 5.44LPKK127 pKa = 10.79YY128 pKa = 6.04MTPPATWRR136 pKa = 11.84FGLL139 pKa = 4.06
Molecular weight: 15.2 kDa
Isoelectric point according different methods:
Peptides (in silico digests for buttom-up proteomics)
Below you can find in silico digests of the whole proteome with Trypsin, Chymotrypsin, Trypsin+LysC, LysN, ArgC proteases suitable for different mass spec machines.| Try ESI |
 |
|---|
| ChTry ESI |
|
|---|
| ArgC ESI |
|
|---|
| LysN ESI |
|
|---|
| TryLysC ESI |
|
|---|
| Try MALDI |
|
|---|
| ChTry MALDI |
|
|---|
| ArgC MALDI |
|
|---|
| LysN MALDI |
|
|---|
| TryLysC MALDI |
|
|---|
| Try LTQ |
|
|---|
| ChTry LTQ |
|
|---|
| ArgC LTQ |
|
|---|
| LysN LTQ |
|
|---|
| TryLysC LTQ |
|
|---|
| Try MSlow |
|
|---|
| ChTry MSlow |
|
|---|
| ArgC MSlow |
|
|---|
| LysN MSlow |
|
|---|
| TryLysC MSlow |
|
|---|
| Try MShigh |
|
|---|
| ChTry MShigh |
|
|---|
| ArgC MShigh |
|
|---|
| LysN MShigh |
|
|---|
| TryLysC MShigh |
|
|---|
General Statistics
Number of major isoforms |
Number of additional isoforms |
Number of all proteins |
Number of amino acids |
Min. Seq. Length |
Max. Seq. Length |
Avg. Seq. Length |
Avg. Mol. Weight |
|---|---|---|---|---|---|---|---|
0 |
10005 |
88 |
4470 |
1000.5 |
111.76 |
Amino acid frequency
Ala |
Cys |
Asp |
Glu |
Phe |
Gly |
His |
Ile |
Lys |
Leu |
|---|---|---|---|---|---|---|---|---|---|
6.897 ± 0.386 | 3.758 ± 0.515 |
5.537 ± 0.365 | 4.178 ± 0.313 |
5.247 ± 0.267 | 6.217 ± 0.535 |
1.719 ± 0.282 | 4.458 ± 0.581 |
5.737 ± 0.382 | 9.175 ± 0.538 |
Met |
Asn |
Gln |
Pro |
Arg |
Ser |
Thr |
Val |
Trp |
Tyr |
|---|---|---|---|---|---|---|---|---|---|
2.209 ± 0.262 | 5.087 ± 0.722 |
3.968 ± 0.671 | 3.518 ± 0.684 |
3.878 ± 0.513 | 7.046 ± 0.309 |
5.837 ± 0.483 | 9.475 ± 1.274 |
1.299 ± 0.12 | 4.758 ± 0.401 |
Most of the basic statistics you can see at this page can be downloaded from this CSV file
See this proteome in:

Proteome-pI is available under Creative Commons Attribution-NoDerivs license, for more details see here
| Reference: Kozlowski LP. Proteome-pI 2.0: Proteome Isoelectric Point Database Update. Nucleic Acids Res. 2021, doi: 10.1093/nar/gkab944 | Contact: Lukasz P. Kozlowski |