Microbacterium sp. CGR2
Taxonomy: cellular organisms; Bacteria; Terrabacteria group; Actinobacteria; Actinomycetia; Micrococcales; Microbacteriaceae; Microbacterium; unclassified Microbacterium
Average proteome isoelectric point is 5.99
Get precalculated fractions of proteins
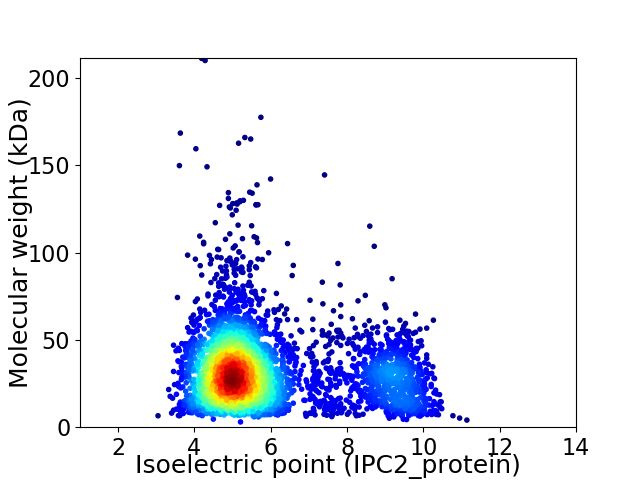
Virtual 2D-PAGE plot for 3832 proteins (isoelectric point calculated using IPC2_protein)
Get csv file with sequences according to given criteria:
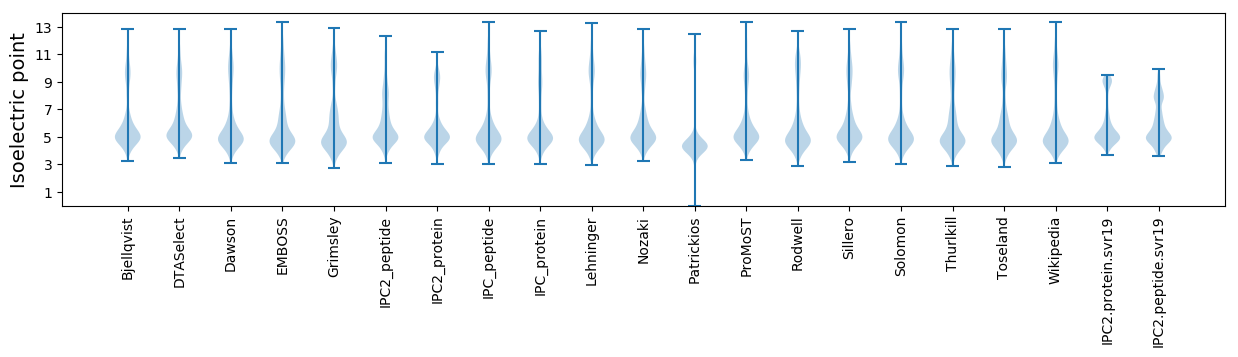
* You can choose from 21 different methods for calculating isoelectric point
Summary statistics related to proteome-wise predictions

Protein with the lowest isoelectric point:
>tr|A0A3B0BAN9|A0A3B0BAN9_9MICO Transcription termination factor Rho OS=Microbacterium sp. CGR2 OX=1805820 GN=rho PE=3 SV=1
MM1 pKa = 7.69PRR3 pKa = 11.84RR4 pKa = 11.84NLFAGLALAATATLALSGCATGGSDD29 pKa = 4.87DD30 pKa = 4.21TDD32 pKa = 3.91AGAPAAGEE40 pKa = 4.12DD41 pKa = 3.58YY42 pKa = 11.51GLIEE46 pKa = 5.91DD47 pKa = 4.39GTLTVCSDD55 pKa = 2.68IPYY58 pKa = 10.6APFEE62 pKa = 4.33FEE64 pKa = 4.81GGDD67 pKa = 3.25NGTGYY72 pKa = 9.24TGFDD76 pKa = 3.56IDD78 pKa = 5.52LLDD81 pKa = 5.62AIAKK85 pKa = 10.24KK86 pKa = 10.58LDD88 pKa = 3.55LKK90 pKa = 11.21LAVQDD95 pKa = 3.78VAFEE99 pKa = 4.3ALQSGTTLASGQCDD113 pKa = 2.83IGASAMTITEE123 pKa = 3.98EE124 pKa = 3.86RR125 pKa = 11.84KK126 pKa = 10.48ANIDD130 pKa = 3.5FSDD133 pKa = 4.32PYY135 pKa = 11.01YY136 pKa = 11.11DD137 pKa = 3.78SLQSLLVGTDD147 pKa = 3.3SGIEE151 pKa = 4.19SIDD154 pKa = 3.82DD155 pKa = 3.97LDD157 pKa = 4.1GKK159 pKa = 10.82AVGVQQGTTGEE170 pKa = 4.23AYY172 pKa = 10.44ANEE175 pKa = 4.15NAEE178 pKa = 3.99GAEE181 pKa = 4.0IVQYY185 pKa = 10.78PSDD188 pKa = 4.19GEE190 pKa = 4.12LWPAMQSGLIDD201 pKa = 6.3AILQDD206 pKa = 3.45QPVNLEE212 pKa = 4.0HH213 pKa = 7.04EE214 pKa = 4.62KK215 pKa = 11.13ADD217 pKa = 3.56DD218 pKa = 3.83AYY220 pKa = 10.78AIVEE224 pKa = 4.25EE225 pKa = 4.76YY226 pKa = 8.21EE227 pKa = 4.05TGEE230 pKa = 4.18SYY232 pKa = 11.4GFAFAKK238 pKa = 10.45GEE240 pKa = 3.97RR241 pKa = 11.84DD242 pKa = 3.48EE243 pKa = 5.57LLEE246 pKa = 4.24AVNGALAEE254 pKa = 4.41LKK256 pKa = 10.82DD257 pKa = 3.56SGDD260 pKa = 3.38YY261 pKa = 8.96KK262 pKa = 10.68TIYY265 pKa = 9.15DD266 pKa = 3.83TYY268 pKa = 9.68FTAKK272 pKa = 10.3
MM1 pKa = 7.69PRR3 pKa = 11.84RR4 pKa = 11.84NLFAGLALAATATLALSGCATGGSDD29 pKa = 4.87DD30 pKa = 4.21TDD32 pKa = 3.91AGAPAAGEE40 pKa = 4.12DD41 pKa = 3.58YY42 pKa = 11.51GLIEE46 pKa = 5.91DD47 pKa = 4.39GTLTVCSDD55 pKa = 2.68IPYY58 pKa = 10.6APFEE62 pKa = 4.33FEE64 pKa = 4.81GGDD67 pKa = 3.25NGTGYY72 pKa = 9.24TGFDD76 pKa = 3.56IDD78 pKa = 5.52LLDD81 pKa = 5.62AIAKK85 pKa = 10.24KK86 pKa = 10.58LDD88 pKa = 3.55LKK90 pKa = 11.21LAVQDD95 pKa = 3.78VAFEE99 pKa = 4.3ALQSGTTLASGQCDD113 pKa = 2.83IGASAMTITEE123 pKa = 3.98EE124 pKa = 3.86RR125 pKa = 11.84KK126 pKa = 10.48ANIDD130 pKa = 3.5FSDD133 pKa = 4.32PYY135 pKa = 11.01YY136 pKa = 11.11DD137 pKa = 3.78SLQSLLVGTDD147 pKa = 3.3SGIEE151 pKa = 4.19SIDD154 pKa = 3.82DD155 pKa = 3.97LDD157 pKa = 4.1GKK159 pKa = 10.82AVGVQQGTTGEE170 pKa = 4.23AYY172 pKa = 10.44ANEE175 pKa = 4.15NAEE178 pKa = 3.99GAEE181 pKa = 4.0IVQYY185 pKa = 10.78PSDD188 pKa = 4.19GEE190 pKa = 4.12LWPAMQSGLIDD201 pKa = 6.3AILQDD206 pKa = 3.45QPVNLEE212 pKa = 4.0HH213 pKa = 7.04EE214 pKa = 4.62KK215 pKa = 11.13ADD217 pKa = 3.56DD218 pKa = 3.83AYY220 pKa = 10.78AIVEE224 pKa = 4.25EE225 pKa = 4.76YY226 pKa = 8.21EE227 pKa = 4.05TGEE230 pKa = 4.18SYY232 pKa = 11.4GFAFAKK238 pKa = 10.45GEE240 pKa = 3.97RR241 pKa = 11.84DD242 pKa = 3.48EE243 pKa = 5.57LLEE246 pKa = 4.24AVNGALAEE254 pKa = 4.41LKK256 pKa = 10.82DD257 pKa = 3.56SGDD260 pKa = 3.38YY261 pKa = 8.96KK262 pKa = 10.68TIYY265 pKa = 9.15DD266 pKa = 3.83TYY268 pKa = 9.68FTAKK272 pKa = 10.3
Molecular weight: 28.65 kDa
Isoelectric point according different methods:
Protein with the highest isoelectric point:
>tr|A0A3B0B3X4|A0A3B0B3X4_9MICO Uncharacterized protein OS=Microbacterium sp. CGR2 OX=1805820 GN=D7252_07510 PE=4 SV=1
MM1 pKa = 7.4GSVIKK6 pKa = 10.42KK7 pKa = 8.47RR8 pKa = 11.84RR9 pKa = 11.84KK10 pKa = 9.22RR11 pKa = 11.84MAKK14 pKa = 9.41KK15 pKa = 9.87KK16 pKa = 9.7HH17 pKa = 5.84RR18 pKa = 11.84KK19 pKa = 8.56LLRR22 pKa = 11.84KK23 pKa = 7.78TRR25 pKa = 11.84HH26 pKa = 3.65QRR28 pKa = 11.84RR29 pKa = 11.84NKK31 pKa = 9.78KK32 pKa = 9.85
MM1 pKa = 7.4GSVIKK6 pKa = 10.42KK7 pKa = 8.47RR8 pKa = 11.84RR9 pKa = 11.84KK10 pKa = 9.22RR11 pKa = 11.84MAKK14 pKa = 9.41KK15 pKa = 9.87KK16 pKa = 9.7HH17 pKa = 5.84RR18 pKa = 11.84KK19 pKa = 8.56LLRR22 pKa = 11.84KK23 pKa = 7.78TRR25 pKa = 11.84HH26 pKa = 3.65QRR28 pKa = 11.84RR29 pKa = 11.84NKK31 pKa = 9.78KK32 pKa = 9.85
Molecular weight: 4.08 kDa
Isoelectric point according different methods:
Peptides (in silico digests for buttom-up proteomics)
Below you can find in silico digests of the whole proteome with Trypsin, Chymotrypsin, Trypsin+LysC, LysN, ArgC proteases suitable for different mass spec machines.| Try ESI |
 |
|---|
| ChTry ESI |
|
|---|
| ArgC ESI |
|
|---|
| LysN ESI |
|
|---|
| TryLysC ESI |
|
|---|
| Try MALDI |
|
|---|
| ChTry MALDI |
|
|---|
| ArgC MALDI |
|
|---|
| LysN MALDI |
|
|---|
| TryLysC MALDI |
|
|---|
| Try LTQ |
|
|---|
| ChTry LTQ |
|
|---|
| ArgC LTQ |
|
|---|
| LysN LTQ |
|
|---|
| TryLysC LTQ |
|
|---|
| Try MSlow |
|
|---|
| ChTry MSlow |
|
|---|
| ArgC MSlow |
|
|---|
| LysN MSlow |
|
|---|
| TryLysC MSlow |
|
|---|
| Try MShigh |
|
|---|
| ChTry MShigh |
|
|---|
| ArgC MShigh |
|
|---|
| LysN MShigh |
|
|---|
| TryLysC MShigh |
|
|---|
General Statistics
Number of major isoforms |
Number of additional isoforms |
Number of all proteins |
Number of amino acids |
Min. Seq. Length |
Max. Seq. Length |
Avg. Seq. Length |
Avg. Mol. Weight |
|---|---|---|---|---|---|---|---|
0 |
1195693 |
29 |
2022 |
312.0 |
33.47 |
Amino acid frequency
Ala |
Cys |
Asp |
Glu |
Phe |
Gly |
His |
Ile |
Lys |
Leu |
|---|---|---|---|---|---|---|---|---|---|
13.29 ± 0.053 | 0.472 ± 0.009 |
6.291 ± 0.037 | 5.844 ± 0.039 |
3.186 ± 0.024 | 8.762 ± 0.032 |
2.023 ± 0.02 | 4.821 ± 0.028 |
1.974 ± 0.03 | 10.026 ± 0.045 |
Met |
Asn |
Gln |
Pro |
Arg |
Ser |
Thr |
Val |
Trp |
Tyr |
|---|---|---|---|---|---|---|---|---|---|
1.884 ± 0.017 | 2.008 ± 0.023 |
5.235 ± 0.028 | 2.818 ± 0.019 |
7.263 ± 0.047 | 5.747 ± 0.026 |
6.109 ± 0.032 | 8.778 ± 0.038 |
1.541 ± 0.018 | 1.93 ± 0.016 |
Most of the basic statistics you can see at this page can be downloaded from this CSV file
See this proteome in:

Proteome-pI is available under Creative Commons Attribution-NoDerivs license, for more details see here
| Reference: Kozlowski LP. Proteome-pI 2.0: Proteome Isoelectric Point Database Update. Nucleic Acids Res. 2021, doi: 10.1093/nar/gkab944 | Contact: Lukasz P. Kozlowski |