Capybara microvirus Cap3_SP_562
Taxonomy: Viruses; Monodnaviria; Sangervirae; Phixviricota; Malgrandaviricetes; Petitvirales; Microviridae; unclassified Microviridae
Average proteome isoelectric point is 5.54
Get precalculated fractions of proteins
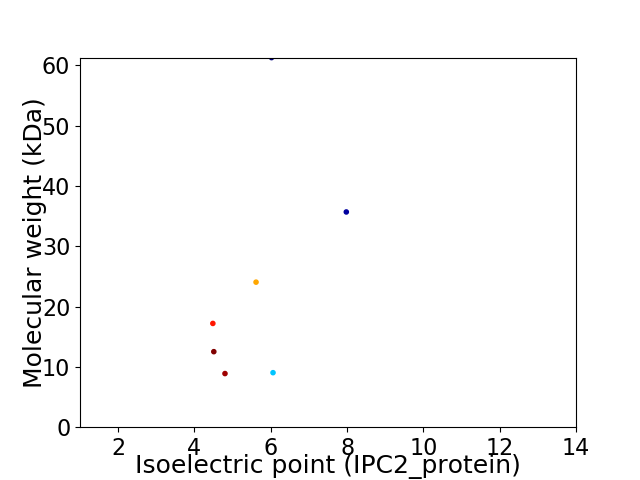
Virtual 2D-PAGE plot for 7 proteins (isoelectric point calculated using IPC2_protein)
Get csv file with sequences according to given criteria:
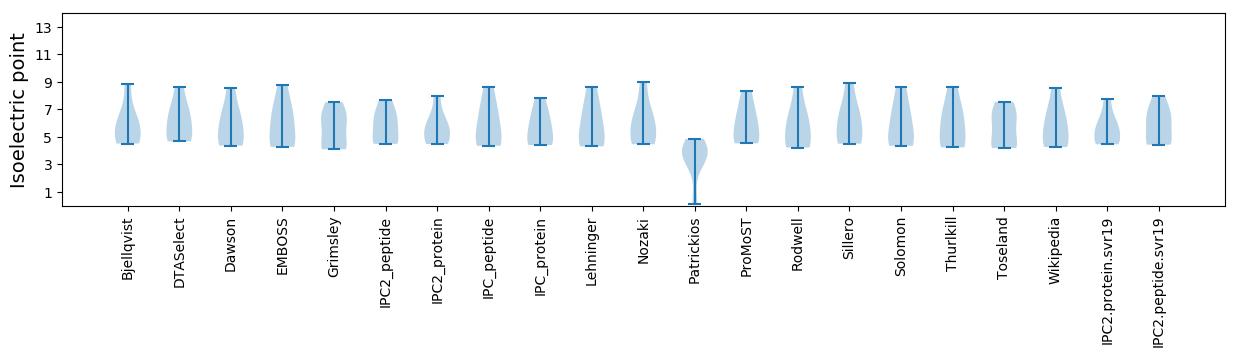
* You can choose from 21 different methods for calculating isoelectric point
Summary statistics related to proteome-wise predictions
Protein with the lowest isoelectric point:
>tr|A0A4P8W8W4|A0A4P8W8W4_9VIRU Minor capsid protein OS=Capybara microvirus Cap3_SP_562 OX=2585476 PE=4 SV=1
MM1 pKa = 7.56YY2 pKa = 9.84DD3 pKa = 3.17VKK5 pKa = 11.38VYY7 pKa = 9.66VYY9 pKa = 9.69CLRR12 pKa = 11.84EE13 pKa = 3.73ASFSNDD19 pKa = 2.55SKK21 pKa = 11.76SNYY24 pKa = 8.67EE25 pKa = 3.71IKK27 pKa = 10.57ACYY30 pKa = 10.01DD31 pKa = 3.31HH32 pKa = 6.8VSCYY36 pKa = 10.5SVDD39 pKa = 3.29MYY41 pKa = 11.8YY42 pKa = 11.06SLANNLGSLRR52 pKa = 11.84LVDD55 pKa = 5.35RR56 pKa = 11.84FATTPNLDD64 pKa = 4.27SIDD67 pKa = 5.0LYY69 pKa = 10.47IDD71 pKa = 3.91CYY73 pKa = 10.82FADD76 pKa = 5.37FDD78 pKa = 4.14NTCCSMYY85 pKa = 10.5IRR87 pKa = 11.84MLILEE92 pKa = 4.57NNFDD96 pKa = 3.96TLIKK100 pKa = 10.5LFRR103 pKa = 11.84NGLCC107 pKa = 3.9
MM1 pKa = 7.56YY2 pKa = 9.84DD3 pKa = 3.17VKK5 pKa = 11.38VYY7 pKa = 9.66VYY9 pKa = 9.69CLRR12 pKa = 11.84EE13 pKa = 3.73ASFSNDD19 pKa = 2.55SKK21 pKa = 11.76SNYY24 pKa = 8.67EE25 pKa = 3.71IKK27 pKa = 10.57ACYY30 pKa = 10.01DD31 pKa = 3.31HH32 pKa = 6.8VSCYY36 pKa = 10.5SVDD39 pKa = 3.29MYY41 pKa = 11.8YY42 pKa = 11.06SLANNLGSLRR52 pKa = 11.84LVDD55 pKa = 5.35RR56 pKa = 11.84FATTPNLDD64 pKa = 4.27SIDD67 pKa = 5.0LYY69 pKa = 10.47IDD71 pKa = 3.91CYY73 pKa = 10.82FADD76 pKa = 5.37FDD78 pKa = 4.14NTCCSMYY85 pKa = 10.5IRR87 pKa = 11.84MLILEE92 pKa = 4.57NNFDD96 pKa = 3.96TLIKK100 pKa = 10.5LFRR103 pKa = 11.84NGLCC107 pKa = 3.9
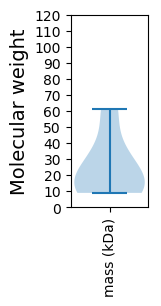
Molecular weight: 12.53 kDa
Isoelectric point according different methods:
Protein with the highest isoelectric point:
>tr|A0A4P8W665|A0A4P8W665_9VIRU Nonstructural protein OS=Capybara microvirus Cap3_SP_562 OX=2585476 PE=4 SV=1
MM1 pKa = 7.51CVNPKK6 pKa = 10.35FGFLVTDD13 pKa = 3.9SFRR16 pKa = 11.84SGLIKK21 pKa = 10.46RR22 pKa = 11.84SVHH25 pKa = 5.37FCTKK29 pKa = 7.75EE30 pKa = 3.47HH31 pKa = 5.77YY32 pKa = 10.66LYY34 pKa = 10.3MLEE37 pKa = 5.16NVDD40 pKa = 3.29IYY42 pKa = 11.25KK43 pKa = 10.36NEE45 pKa = 3.93YY46 pKa = 9.4HH47 pKa = 6.41SEE49 pKa = 3.9PMTFPCGRR57 pKa = 11.84CPEE60 pKa = 4.45CCMEE64 pKa = 5.65HH65 pKa = 7.0ADD67 pKa = 3.21AWAYY71 pKa = 10.91RR72 pKa = 11.84IMNEE76 pKa = 3.99ASQYY80 pKa = 11.39DD81 pKa = 4.28DD82 pKa = 3.51NCFITLTYY90 pKa = 11.26ANTDD94 pKa = 2.91NVNYY98 pKa = 10.67DD99 pKa = 3.31NASLQKK105 pKa = 10.45KK106 pKa = 9.67DD107 pKa = 3.22VQDD110 pKa = 3.56FVKK113 pKa = 10.54RR114 pKa = 11.84LRR116 pKa = 11.84EE117 pKa = 3.97RR118 pKa = 11.84IRR120 pKa = 11.84RR121 pKa = 11.84ASGKK125 pKa = 9.97KK126 pKa = 9.32IRR128 pKa = 11.84FFCCGEE134 pKa = 3.96YY135 pKa = 10.82GEE137 pKa = 4.83KK138 pKa = 9.94KK139 pKa = 9.89QRR141 pKa = 11.84PHH143 pKa = 4.85YY144 pKa = 10.13HH145 pKa = 6.7IIIFGWKK152 pKa = 9.73PNDD155 pKa = 3.22LKK157 pKa = 11.26YY158 pKa = 11.03FKK160 pKa = 9.84TINKK164 pKa = 8.9HH165 pKa = 4.38IVYY168 pKa = 9.06TSEE171 pKa = 3.93FVRR174 pKa = 11.84DD175 pKa = 3.23VWKK178 pKa = 9.91WGFITVSEE186 pKa = 4.59VEE188 pKa = 4.89LEE190 pKa = 4.23TALYY194 pKa = 9.67SALYY198 pKa = 7.79MQKK201 pKa = 10.6LLPKK205 pKa = 9.88QVGKK209 pKa = 10.39SEE211 pKa = 4.25PFLLMSTNPGIGYY224 pKa = 9.35NFLINNIDD232 pKa = 3.71NLILTDD238 pKa = 4.18KK239 pKa = 10.66IIVNGHH245 pKa = 4.31TCKK248 pKa = 10.59LPRR251 pKa = 11.84YY252 pKa = 7.36YY253 pKa = 10.95LRR255 pKa = 11.84VLEE258 pKa = 5.52DD259 pKa = 4.03KK260 pKa = 11.06LLLDD264 pKa = 4.01TSTLRR269 pKa = 11.84KK270 pKa = 9.31NRR272 pKa = 11.84SIKK275 pKa = 10.55SEE277 pKa = 3.98LAASSLDD284 pKa = 3.42FSGKK288 pKa = 9.43IEE290 pKa = 4.23IYY292 pKa = 10.18KK293 pKa = 10.42KK294 pKa = 10.04LYY296 pKa = 9.96NWFIPDD302 pKa = 3.31TT303 pKa = 4.14
MM1 pKa = 7.51CVNPKK6 pKa = 10.35FGFLVTDD13 pKa = 3.9SFRR16 pKa = 11.84SGLIKK21 pKa = 10.46RR22 pKa = 11.84SVHH25 pKa = 5.37FCTKK29 pKa = 7.75EE30 pKa = 3.47HH31 pKa = 5.77YY32 pKa = 10.66LYY34 pKa = 10.3MLEE37 pKa = 5.16NVDD40 pKa = 3.29IYY42 pKa = 11.25KK43 pKa = 10.36NEE45 pKa = 3.93YY46 pKa = 9.4HH47 pKa = 6.41SEE49 pKa = 3.9PMTFPCGRR57 pKa = 11.84CPEE60 pKa = 4.45CCMEE64 pKa = 5.65HH65 pKa = 7.0ADD67 pKa = 3.21AWAYY71 pKa = 10.91RR72 pKa = 11.84IMNEE76 pKa = 3.99ASQYY80 pKa = 11.39DD81 pKa = 4.28DD82 pKa = 3.51NCFITLTYY90 pKa = 11.26ANTDD94 pKa = 2.91NVNYY98 pKa = 10.67DD99 pKa = 3.31NASLQKK105 pKa = 10.45KK106 pKa = 9.67DD107 pKa = 3.22VQDD110 pKa = 3.56FVKK113 pKa = 10.54RR114 pKa = 11.84LRR116 pKa = 11.84EE117 pKa = 3.97RR118 pKa = 11.84IRR120 pKa = 11.84RR121 pKa = 11.84ASGKK125 pKa = 9.97KK126 pKa = 9.32IRR128 pKa = 11.84FFCCGEE134 pKa = 3.96YY135 pKa = 10.82GEE137 pKa = 4.83KK138 pKa = 9.94KK139 pKa = 9.89QRR141 pKa = 11.84PHH143 pKa = 4.85YY144 pKa = 10.13HH145 pKa = 6.7IIIFGWKK152 pKa = 9.73PNDD155 pKa = 3.22LKK157 pKa = 11.26YY158 pKa = 11.03FKK160 pKa = 9.84TINKK164 pKa = 8.9HH165 pKa = 4.38IVYY168 pKa = 9.06TSEE171 pKa = 3.93FVRR174 pKa = 11.84DD175 pKa = 3.23VWKK178 pKa = 9.91WGFITVSEE186 pKa = 4.59VEE188 pKa = 4.89LEE190 pKa = 4.23TALYY194 pKa = 9.67SALYY198 pKa = 7.79MQKK201 pKa = 10.6LLPKK205 pKa = 9.88QVGKK209 pKa = 10.39SEE211 pKa = 4.25PFLLMSTNPGIGYY224 pKa = 9.35NFLINNIDD232 pKa = 3.71NLILTDD238 pKa = 4.18KK239 pKa = 10.66IIVNGHH245 pKa = 4.31TCKK248 pKa = 10.59LPRR251 pKa = 11.84YY252 pKa = 7.36YY253 pKa = 10.95LRR255 pKa = 11.84VLEE258 pKa = 5.52DD259 pKa = 4.03KK260 pKa = 11.06LLLDD264 pKa = 4.01TSTLRR269 pKa = 11.84KK270 pKa = 9.31NRR272 pKa = 11.84SIKK275 pKa = 10.55SEE277 pKa = 3.98LAASSLDD284 pKa = 3.42FSGKK288 pKa = 9.43IEE290 pKa = 4.23IYY292 pKa = 10.18KK293 pKa = 10.42KK294 pKa = 10.04LYY296 pKa = 9.96NWFIPDD302 pKa = 3.31TT303 pKa = 4.14
Molecular weight: 35.7 kDa
Isoelectric point according different methods:
Peptides (in silico digests for buttom-up proteomics)
Below you can find in silico digests of the whole proteome with Trypsin, Chymotrypsin, Trypsin+LysC, LysN, ArgC proteases suitable for different mass spec machines.| Try ESI |
 |
|---|
| ChTry ESI |
|
|---|
| ArgC ESI |
|
|---|
| LysN ESI |
|
|---|
| TryLysC ESI |
|
|---|
| Try MALDI |
|
|---|
| ChTry MALDI |
|
|---|
| ArgC MALDI |
|
|---|
| LysN MALDI |
|
|---|
| TryLysC MALDI |
|
|---|
| Try LTQ |
|
|---|
| ChTry LTQ |
|
|---|
| ArgC LTQ |
|
|---|
| LysN LTQ |
|
|---|
| TryLysC LTQ |
|
|---|
| Try MSlow |
|
|---|
| ChTry MSlow |
|
|---|
| ArgC MSlow |
|
|---|
| LysN MSlow |
|
|---|
| TryLysC MSlow |
|
|---|
| Try MShigh |
|
|---|
| ChTry MShigh |
|
|---|
| ArgC MShigh |
|
|---|
| LysN MShigh |
|
|---|
| TryLysC MShigh |
|
|---|
General Statistics
Number of major isoforms |
Number of additional isoforms |
Number of all proteins |
Number of amino acids |
Min. Seq. Length |
Max. Seq. Length |
Avg. Seq. Length |
Avg. Mol. Weight |
|---|---|---|---|---|---|---|---|
0 |
1490 |
78 |
551 |
212.9 |
24.1 |
Amino acid frequency
Ala |
Cys |
Asp |
Glu |
Phe |
Gly |
His |
Ile |
Lys |
Leu |
|---|---|---|---|---|---|---|---|---|---|
6.577 ± 1.024 | 1.812 ± 0.707 |
6.51 ± 0.797 | 4.631 ± 0.688 |
5.302 ± 0.4 | 5.839 ± 0.963 |
1.477 ± 0.456 | 6.711 ± 0.624 |
6.309 ± 1.164 | 9.128 ± 0.986 |
Met |
Asn |
Gln |
Pro |
Arg |
Ser |
Thr |
Val |
Trp |
Tyr |
|---|---|---|---|---|---|---|---|---|---|
1.812 ± 0.245 | 7.047 ± 0.701 |
3.624 ± 1.332 | 3.826 ± 0.761 |
3.893 ± 0.547 | 7.651 ± 0.765 |
6.107 ± 0.636 | 4.966 ± 0.556 |
1.007 ± 0.272 | 5.772 ± 0.497 |
Most of the basic statistics you can see at this page can be downloaded from this CSV file
See this proteome in:

Proteome-pI is available under Creative Commons Attribution-NoDerivs license, for more details see here
| Reference: Kozlowski LP. Proteome-pI 2.0: Proteome Isoelectric Point Database Update. Nucleic Acids Res. 2021, doi: 10.1093/nar/gkab944 | Contact: Lukasz P. Kozlowski |