Vibrio virus 2019VC1
Taxonomy: Viruses; Duplodnaviria; Heunggongvirae; Uroviricota; Caudoviricetes; Caudovirales; Drexlerviridae; Jhansiroadvirus
Average proteome isoelectric point is 6.97
Get precalculated fractions of proteins
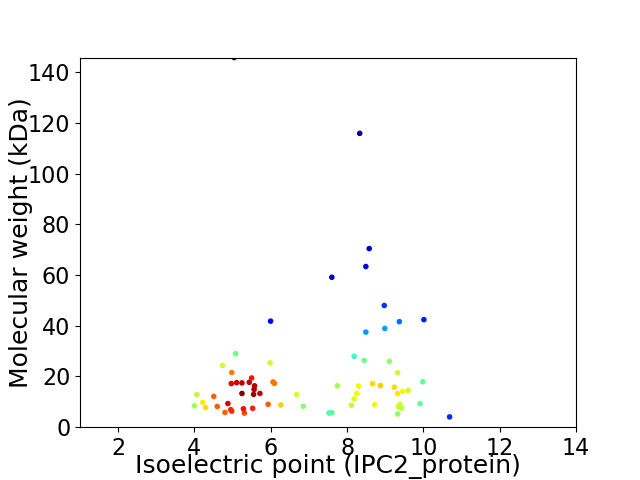
Virtual 2D-PAGE plot for 69 proteins (isoelectric point calculated using IPC2_protein)
Get csv file with sequences according to given criteria:
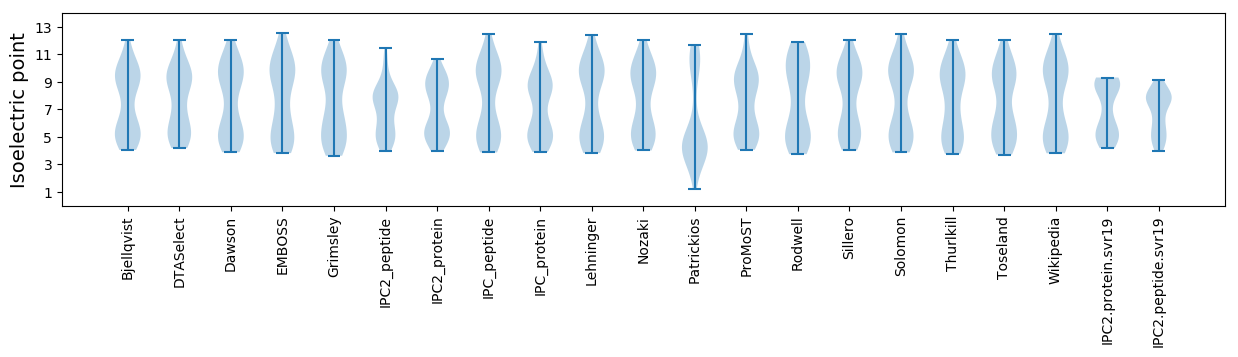
* You can choose from 21 different methods for calculating isoelectric point
Summary statistics related to proteome-wise predictions
Protein with the lowest isoelectric point:
>tr|A0A6M5CAX0|A0A6M5CAX0_9CAUD Uncharacterized protein OS=Vibrio virus 2019VC1 OX=2761539 GN=2019VC1_48 PE=4 SV=1
MM1 pKa = 8.02NMICKK6 pKa = 10.17ASCSDD11 pKa = 2.88WFTAGRR17 pKa = 11.84VYY19 pKa = 9.86PAAMEE24 pKa = 4.56NPTFMISAITGDD36 pKa = 4.45DD37 pKa = 3.49MVSDD41 pKa = 4.02LTVTDD46 pKa = 3.77LTGLFQLTDD55 pKa = 3.23IKK57 pKa = 11.01RR58 pKa = 11.84CLSLFAALHH67 pKa = 5.94LSFPAYY73 pKa = 10.41SGG75 pKa = 3.34
MM1 pKa = 8.02NMICKK6 pKa = 10.17ASCSDD11 pKa = 2.88WFTAGRR17 pKa = 11.84VYY19 pKa = 9.86PAAMEE24 pKa = 4.56NPTFMISAITGDD36 pKa = 4.45DD37 pKa = 3.49MVSDD41 pKa = 4.02LTVTDD46 pKa = 3.77LTGLFQLTDD55 pKa = 3.23IKK57 pKa = 11.01RR58 pKa = 11.84CLSLFAALHH67 pKa = 5.94LSFPAYY73 pKa = 10.41SGG75 pKa = 3.34
Molecular weight: 8.17 kDa
Isoelectric point according different methods:
Protein with the highest isoelectric point:
>tr|A0A6M5CA15|A0A6M5CA15_9CAUD Uncharacterized protein OS=Vibrio virus 2019VC1 OX=2761539 GN=2019VC1_49 PE=4 SV=1
MM1 pKa = 7.52RR2 pKa = 11.84RR3 pKa = 11.84CIFHH7 pKa = 6.93SPLIPVRR14 pKa = 11.84FKK16 pKa = 11.23GLEE19 pKa = 3.55IADD22 pKa = 4.53NIRR25 pKa = 11.84TAAASGRR32 pKa = 11.84LFLRR36 pKa = 11.84KK37 pKa = 9.4SSQNIAIRR45 pKa = 11.84MFNDD49 pKa = 2.96KK50 pKa = 10.52FINDD54 pKa = 3.81GARR57 pKa = 11.84NDD59 pKa = 3.79DD60 pKa = 3.82EE61 pKa = 5.99RR62 pKa = 11.84NVLAA66 pKa = 5.68
MM1 pKa = 7.52RR2 pKa = 11.84RR3 pKa = 11.84CIFHH7 pKa = 6.93SPLIPVRR14 pKa = 11.84FKK16 pKa = 11.23GLEE19 pKa = 3.55IADD22 pKa = 4.53NIRR25 pKa = 11.84TAAASGRR32 pKa = 11.84LFLRR36 pKa = 11.84KK37 pKa = 9.4SSQNIAIRR45 pKa = 11.84MFNDD49 pKa = 2.96KK50 pKa = 10.52FINDD54 pKa = 3.81GARR57 pKa = 11.84NDD59 pKa = 3.79DD60 pKa = 3.82EE61 pKa = 5.99RR62 pKa = 11.84NVLAA66 pKa = 5.68
Molecular weight: 7.56 kDa
Isoelectric point according different methods:
Peptides (in silico digests for buttom-up proteomics)
Below you can find in silico digests of the whole proteome with Trypsin, Chymotrypsin, Trypsin+LysC, LysN, ArgC proteases suitable for different mass spec machines.| Try ESI |
 |
|---|
| ChTry ESI |
|
|---|
| ArgC ESI |
|
|---|
| LysN ESI |
|
|---|
| TryLysC ESI |
|
|---|
| Try MALDI |
|
|---|
| ChTry MALDI |
|
|---|
| ArgC MALDI |
|
|---|
| LysN MALDI |
|
|---|
| TryLysC MALDI |
|
|---|
| Try LTQ |
|
|---|
| ChTry LTQ |
|
|---|
| ArgC LTQ |
|
|---|
| LysN LTQ |
|
|---|
| TryLysC LTQ |
|
|---|
| Try MSlow |
|
|---|
| ChTry MSlow |
|
|---|
| ArgC MSlow |
|
|---|
| LysN MSlow |
|
|---|
| TryLysC MSlow |
|
|---|
| Try MShigh |
|
|---|
| ChTry MShigh |
|
|---|
| ArgC MShigh |
|
|---|
| LysN MShigh |
|
|---|
| TryLysC MShigh |
|
|---|
General Statistics
Number of major isoforms |
Number of additional isoforms |
Number of all proteins |
Number of amino acids |
Min. Seq. Length |
Max. Seq. Length |
Avg. Seq. Length |
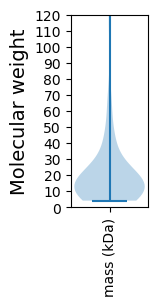
Avg. Mol. Weight |
|---|---|---|---|---|---|---|---|
0 |
13219 |
37 |
1317 |
191.6 |
21.55 |
Amino acid frequency
Ala |
Cys |
Asp |
Glu |
Phe |
Gly |
His |
Ile |
Lys |
Leu |
|---|---|---|---|---|---|---|---|---|---|
8.041 ± 0.459 | 1.324 ± 0.142 |
5.167 ± 0.285 | 6.453 ± 0.287 |
3.873 ± 0.217 | 6.65 ± 0.337 |
2.133 ± 0.243 | 6.702 ± 0.293 |
7.3 ± 0.46 | 7.958 ± 0.472 |
Met |
Asn |
Gln |
Pro |
Arg |
Ser |
Thr |
Val |
Trp |
Tyr |
|---|---|---|---|---|---|---|---|---|---|
2.981 ± 0.175 | 4.531 ± 0.235 |
3.465 ± 0.284 | 3.851 ± 0.336 |
5.999 ± 0.297 | 6.43 ± 0.249 |
5.878 ± 0.346 | 6.74 ± 0.325 |
1.324 ± 0.125 | 3.2 ± 0.275 |
Most of the basic statistics you can see at this page can be downloaded from this CSV file
See this proteome in:

Proteome-pI is available under Creative Commons Attribution-NoDerivs license, for more details see here
| Reference: Kozlowski LP. Proteome-pI 2.0: Proteome Isoelectric Point Database Update. Nucleic Acids Res. 2021, doi: 10.1093/nar/gkab944 | Contact: Lukasz P. Kozlowski |