Paenibacillus phage vB_PlaP_API480
Taxonomy: Viruses; Duplodnaviria; Heunggongvirae; Uroviricota; Caudoviricetes; Caudovirales; Podoviridae; unclassified Podoviridae
Average proteome isoelectric point is 5.88
Get precalculated fractions of proteins
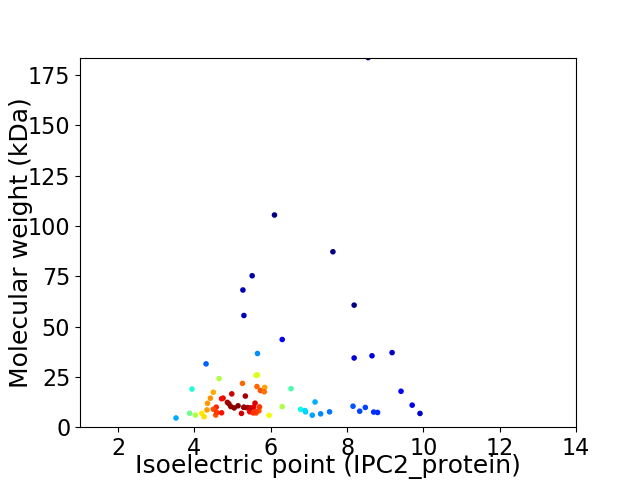
Virtual 2D-PAGE plot for 77 proteins (isoelectric point calculated using IPC2_protein)
Get csv file with sequences according to given criteria:
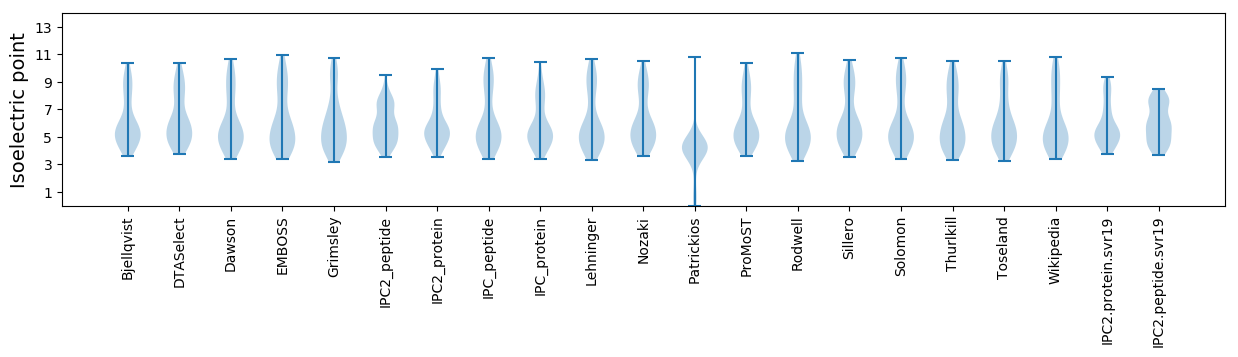
* You can choose from 21 different methods for calculating isoelectric point
Summary statistics related to proteome-wise predictions
Protein with the lowest isoelectric point:
>tr|A0A5B8EHK9|A0A5B8EHK9_9CAUD Uncharacterized protein OS=Paenibacillus phage vB_PlaP_API480 OX=2530020 GN=API480_16 PE=4 SV=1
MM1 pKa = 7.16NVQVIGVIEE10 pKa = 3.91QDD12 pKa = 4.9GYY14 pKa = 10.95ILWAEE19 pKa = 4.12DD20 pKa = 3.46LGVEE24 pKa = 4.1PEE26 pKa = 4.3FYY28 pKa = 10.66GVYY31 pKa = 9.83AQKK34 pKa = 11.0EE35 pKa = 4.18DD36 pKa = 3.8GTYY39 pKa = 10.06EE40 pKa = 3.89WLGDD44 pKa = 3.64FQNISDD50 pKa = 3.74AMRR53 pKa = 11.84YY54 pKa = 9.87LGVKK58 pKa = 10.08NFF60 pKa = 3.66
MM1 pKa = 7.16NVQVIGVIEE10 pKa = 3.91QDD12 pKa = 4.9GYY14 pKa = 10.95ILWAEE19 pKa = 4.12DD20 pKa = 3.46LGVEE24 pKa = 4.1PEE26 pKa = 4.3FYY28 pKa = 10.66GVYY31 pKa = 9.83AQKK34 pKa = 11.0EE35 pKa = 4.18DD36 pKa = 3.8GTYY39 pKa = 10.06EE40 pKa = 3.89WLGDD44 pKa = 3.64FQNISDD50 pKa = 3.74AMRR53 pKa = 11.84YY54 pKa = 9.87LGVKK58 pKa = 10.08NFF60 pKa = 3.66
Molecular weight: 6.93 kDa
Isoelectric point according different methods:
Protein with the highest isoelectric point:
>tr|A0A5B7LZC4|A0A5B7LZC4_9CAUD DUF1599 domain-containing protein OS=Paenibacillus phage vB_PlaP_API480 OX=2530020 GN=API480_3 PE=4 SV=1
MM1 pKa = 6.87KK2 pKa = 10.0TVVLYY7 pKa = 10.72NGRR10 pKa = 11.84TYY12 pKa = 11.12KK13 pKa = 10.48RR14 pKa = 11.84LKK16 pKa = 10.74DD17 pKa = 3.83GMHH20 pKa = 5.98GRR22 pKa = 11.84AFPSNIAGKK31 pKa = 9.86LCRR34 pKa = 11.84QPGCLPYY41 pKa = 10.08IYY43 pKa = 10.01ILVGKK48 pKa = 9.11CLHH51 pKa = 7.09LARR54 pKa = 11.84KK55 pKa = 8.23MVGQRR60 pKa = 3.17
MM1 pKa = 6.87KK2 pKa = 10.0TVVLYY7 pKa = 10.72NGRR10 pKa = 11.84TYY12 pKa = 11.12KK13 pKa = 10.48RR14 pKa = 11.84LKK16 pKa = 10.74DD17 pKa = 3.83GMHH20 pKa = 5.98GRR22 pKa = 11.84AFPSNIAGKK31 pKa = 9.86LCRR34 pKa = 11.84QPGCLPYY41 pKa = 10.08IYY43 pKa = 10.01ILVGKK48 pKa = 9.11CLHH51 pKa = 7.09LARR54 pKa = 11.84KK55 pKa = 8.23MVGQRR60 pKa = 3.17
Molecular weight: 6.82 kDa
Isoelectric point according different methods:
Peptides (in silico digests for buttom-up proteomics)
Below you can find in silico digests of the whole proteome with Trypsin, Chymotrypsin, Trypsin+LysC, LysN, ArgC proteases suitable for different mass spec machines.| Try ESI |
 |
|---|
| ChTry ESI |
|
|---|
| ArgC ESI |
|
|---|
| LysN ESI |
|
|---|
| TryLysC ESI |
|
|---|
| Try MALDI |
|
|---|
| ChTry MALDI |
|
|---|
| ArgC MALDI |
|
|---|
| LysN MALDI |
|
|---|
| TryLysC MALDI |
|
|---|
| Try LTQ |
|
|---|
| ChTry LTQ |
|
|---|
| ArgC LTQ |
|
|---|
| LysN LTQ |
|
|---|
| TryLysC LTQ |
|
|---|
| Try MSlow |
|
|---|
| ChTry MSlow |
|
|---|
| ArgC MSlow |
|
|---|
| LysN MSlow |
|
|---|
| TryLysC MSlow |
|
|---|
| Try MShigh |
|
|---|
| ChTry MShigh |
|
|---|
| ArgC MShigh |
|
|---|
| LysN MShigh |
|
|---|
| TryLysC MShigh |
|
|---|
General Statistics
Number of major isoforms |
Number of additional isoforms |
Number of all proteins |
Number of amino acids |
Min. Seq. Length |
Max. Seq. Length |
Avg. Seq. Length |
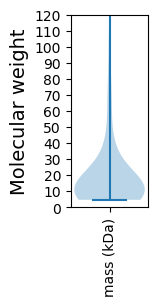
Avg. Mol. Weight |
|---|---|---|---|---|---|---|---|
0 |
13794 |
39 |
1631 |
179.1 |
20.51 |
Amino acid frequency
Ala |
Cys |
Asp |
Glu |
Phe |
Gly |
His |
Ile |
Lys |
Leu |
|---|---|---|---|---|---|---|---|---|---|
6.264 ± 0.471 | 1.131 ± 0.189 |
6.438 ± 0.198 | 8.591 ± 0.432 |
3.893 ± 0.175 | 6.264 ± 0.257 |
1.856 ± 0.141 | 6.713 ± 0.396 |
8.656 ± 0.544 | 8.641 ± 0.312 |
Met |
Asn |
Gln |
Pro |
Arg |
Ser |
Thr |
Val |
Trp |
Tyr |
|---|---|---|---|---|---|---|---|---|---|
2.871 ± 0.127 | 4.756 ± 0.215 |
3.299 ± 0.215 | 3.741 ± 0.264 |
4.683 ± 0.192 | 5.502 ± 0.186 |
4.785 ± 0.193 | 6.09 ± 0.399 |
1.167 ± 0.137 | 4.661 ± 0.189 |
Most of the basic statistics you can see at this page can be downloaded from this CSV file
See this proteome in:

Proteome-pI is available under Creative Commons Attribution-NoDerivs license, for more details see here
| Reference: Kozlowski LP. Proteome-pI 2.0: Proteome Isoelectric Point Database Update. Nucleic Acids Res. 2021, doi: 10.1093/nar/gkab944 | Contact: Lukasz P. Kozlowski |