Geomonas soli
Taxonomy: cellular organisms; Bacteria; Proteobacteria; Betaproteobacteria; Burkholderiales; Comamonadaceae;
Average proteome isoelectric point is 6.85
Get precalculated fractions of proteins
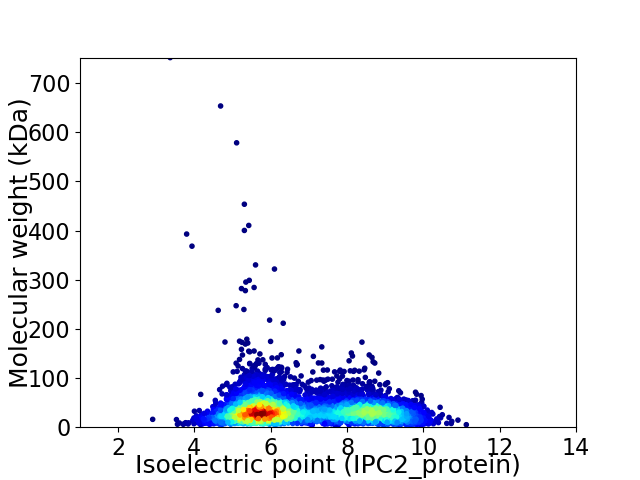
Virtual 2D-PAGE plot for 5762 proteins (isoelectric point calculated using IPC2_protein)
Get csv file with sequences according to given criteria:
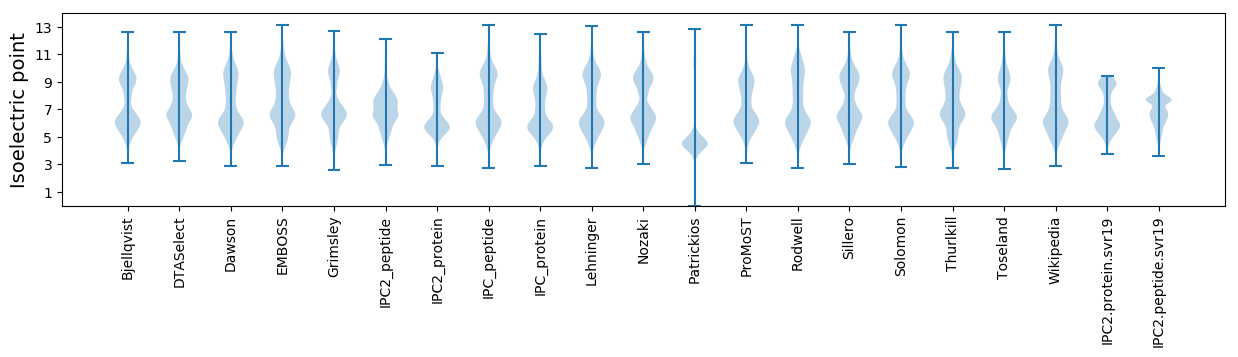
* You can choose from 21 different methods for calculating isoelectric point
Summary statistics related to proteome-wise predictions
Protein with the lowest isoelectric point:
>tr|A0A3N7ITE5|A0A3N7ITE5_9BURK Response regulator OS=Geomonas soli OX=2496871 GN=DZC73_24195 PE=4 SV=1
MM1 pKa = 7.6KK2 pKa = 10.31LLSQLAIGMAIVFTALHH19 pKa = 6.44ANADD23 pKa = 3.88GGTQAGSTFKK33 pKa = 10.69IFTLSITPDD42 pKa = 3.22TDD44 pKa = 3.99DD45 pKa = 4.51QDD47 pKa = 5.83EE48 pKa = 4.19DD49 pKa = 4.21VQWYY53 pKa = 8.89DD54 pKa = 4.94CSGLCQGAA62 pKa = 3.22
MM1 pKa = 7.6KK2 pKa = 10.31LLSQLAIGMAIVFTALHH19 pKa = 6.44ANADD23 pKa = 3.88GGTQAGSTFKK33 pKa = 10.69IFTLSITPDD42 pKa = 3.22TDD44 pKa = 3.99DD45 pKa = 4.51QDD47 pKa = 5.83EE48 pKa = 4.19DD49 pKa = 4.21VQWYY53 pKa = 8.89DD54 pKa = 4.94CSGLCQGAA62 pKa = 3.22
Molecular weight: 6.58 kDa
Isoelectric point according different methods:
Protein with the highest isoelectric point:
>tr|A0A3N7HRI8|A0A3N7HRI8_9BURK GNAT family N-acetyltransferase OS=Geomonas soli OX=2496871 GN=DZC73_18685 PE=4 SV=1
MM1 pKa = 7.33KK2 pKa = 9.38RR3 pKa = 11.84TYY5 pKa = 9.71QASKK9 pKa = 9.04VRR11 pKa = 11.84RR12 pKa = 11.84ARR14 pKa = 11.84THH16 pKa = 5.65GFLVRR21 pKa = 11.84MKK23 pKa = 9.7TRR25 pKa = 11.84GGRR28 pKa = 11.84AVINARR34 pKa = 11.84RR35 pKa = 11.84AKK37 pKa = 9.58GRR39 pKa = 11.84KK40 pKa = 8.75RR41 pKa = 11.84LAVV44 pKa = 3.41
MM1 pKa = 7.33KK2 pKa = 9.38RR3 pKa = 11.84TYY5 pKa = 9.71QASKK9 pKa = 9.04VRR11 pKa = 11.84RR12 pKa = 11.84ARR14 pKa = 11.84THH16 pKa = 5.65GFLVRR21 pKa = 11.84MKK23 pKa = 9.7TRR25 pKa = 11.84GGRR28 pKa = 11.84AVINARR34 pKa = 11.84RR35 pKa = 11.84AKK37 pKa = 9.58GRR39 pKa = 11.84KK40 pKa = 8.75RR41 pKa = 11.84LAVV44 pKa = 3.41
Molecular weight: 5.11 kDa
Isoelectric point according different methods:
Peptides (in silico digests for buttom-up proteomics)
Below you can find in silico digests of the whole proteome with Trypsin, Chymotrypsin, Trypsin+LysC, LysN, ArgC proteases suitable for different mass spec machines.| Try ESI |
 |
|---|
| ChTry ESI |
|
|---|
| ArgC ESI |
|
|---|
| LysN ESI |
|
|---|
| TryLysC ESI |
|
|---|
| Try MALDI |
|
|---|
| ChTry MALDI |
|
|---|
| ArgC MALDI |
|
|---|
| LysN MALDI |
|
|---|
| TryLysC MALDI |
|
|---|
| Try LTQ |
|
|---|
| ChTry LTQ |
|
|---|
| ArgC LTQ |
|
|---|
| LysN LTQ |
|
|---|
| TryLysC LTQ |
|
|---|
| Try MSlow |
|
|---|
| ChTry MSlow |
|
|---|
| ArgC MSlow |
|
|---|
| LysN MSlow |
|
|---|
| TryLysC MSlow |
|
|---|
| Try MShigh |
|
|---|
| ChTry MShigh |
|
|---|
| ArgC MShigh |
|
|---|
| LysN MShigh |
|
|---|
| TryLysC MShigh |
|
|---|
General Statistics
Number of major isoforms |
Number of additional isoforms |
Number of all proteins |
Number of amino acids |
Min. Seq. Length |
Max. Seq. Length |
Avg. Seq. Length |
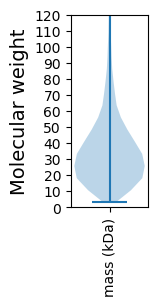
Avg. Mol. Weight |
|---|---|---|---|---|---|---|---|
0 |
1976155 |
24 |
7685 |
343.0 |
37.23 |
Amino acid frequency
Ala |
Cys |
Asp |
Glu |
Phe |
Gly |
His |
Ile |
Lys |
Leu |
|---|---|---|---|---|---|---|---|---|---|
12.614 ± 0.042 | 0.912 ± 0.011 |
5.515 ± 0.023 | 5.222 ± 0.031 |
3.497 ± 0.018 | 8.178 ± 0.034 |
2.353 ± 0.02 | 4.154 ± 0.021 |
3.357 ± 0.035 | 10.346 ± 0.045 |
Met |
Asn |
Gln |
Pro |
Arg |
Ser |
Thr |
Val |
Trp |
Tyr |
|---|---|---|---|---|---|---|---|---|---|
2.499 ± 0.018 | 2.645 ± 0.026 |
5.21 ± 0.027 | 3.941 ± 0.024 |
6.978 ± 0.04 | 5.811 ± 0.027 |
5.337 ± 0.053 | 7.798 ± 0.027 |
1.505 ± 0.017 | 2.128 ± 0.02 |
Most of the basic statistics you can see at this page can be downloaded from this CSV file
See this proteome in:

Proteome-pI is available under Creative Commons Attribution-NoDerivs license, for more details see here
| Reference: Kozlowski LP. Proteome-pI 2.0: Proteome Isoelectric Point Database Update. Nucleic Acids Res. 2021, doi: 10.1093/nar/gkab944 | Contact: Lukasz P. Kozlowski |