Pectobacterium phage Q19
Taxonomy: Viruses; Duplodnaviria; Heunggongvirae; Uroviricota; Caudoviricetes; Caudovirales; Autographiviridae; Studiervirinae; Pektosvirus; unclassified Pektosvirus
Average proteome isoelectric point is 6.63
Get precalculated fractions of proteins
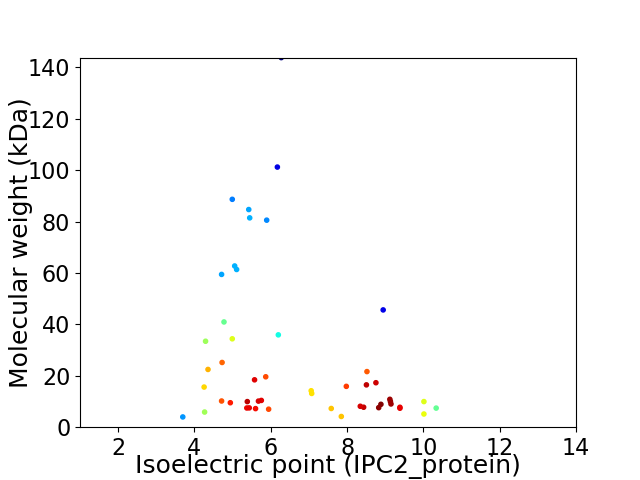
Virtual 2D-PAGE plot for 50 proteins (isoelectric point calculated using IPC2_protein)
Get csv file with sequences according to given criteria:
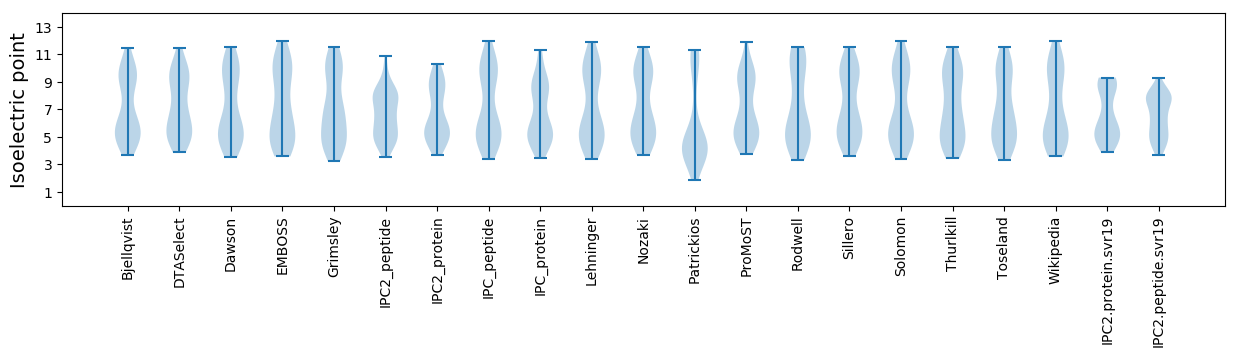
* You can choose from 21 different methods for calculating isoelectric point
Summary statistics related to proteome-wise predictions
Protein with the lowest isoelectric point:
>tr|A0A678ZKE0|A0A678ZKE0_9CAUD DNA primase/helicase OS=Pectobacterium phage Q19 OX=2500576 GN=Q19_21 PE=4 SV=1
MM1 pKa = 7.43IAFMSDD7 pKa = 3.0PANNVWVFLTVFMVTYY23 pKa = 9.74WLLEE27 pKa = 4.28GDD29 pKa = 4.05DD30 pKa = 4.68HH31 pKa = 8.88DD32 pKa = 5.69PII34 pKa = 6.22
MM1 pKa = 7.43IAFMSDD7 pKa = 3.0PANNVWVFLTVFMVTYY23 pKa = 9.74WLLEE27 pKa = 4.28GDD29 pKa = 4.05DD30 pKa = 4.68HH31 pKa = 8.88DD32 pKa = 5.69PII34 pKa = 6.22
Molecular weight: 3.99 kDa
Isoelectric point according different methods:
Protein with the highest isoelectric point:
>tr|A0A678ZZL9|A0A678ZZL9_9CAUD Uncharacterized protein OS=Pectobacterium phage Q19 OX=2500576 GN=Q19_14 PE=4 SV=1
MM1 pKa = 7.57LAPYY5 pKa = 9.34GATVRR10 pKa = 11.84TMKK13 pKa = 10.21RR14 pKa = 11.84RR15 pKa = 11.84CVALGLPSRR24 pKa = 11.84AAKK27 pKa = 10.37ALAKK31 pKa = 9.88HH32 pKa = 5.5HH33 pKa = 6.93HH34 pKa = 6.01NLVTKK39 pKa = 10.53AQADD43 pKa = 3.2WMYY46 pKa = 11.65
MM1 pKa = 7.57LAPYY5 pKa = 9.34GATVRR10 pKa = 11.84TMKK13 pKa = 10.21RR14 pKa = 11.84RR15 pKa = 11.84CVALGLPSRR24 pKa = 11.84AAKK27 pKa = 10.37ALAKK31 pKa = 9.88HH32 pKa = 5.5HH33 pKa = 6.93HH34 pKa = 6.01NLVTKK39 pKa = 10.53AQADD43 pKa = 3.2WMYY46 pKa = 11.65
Molecular weight: 5.14 kDa
Isoelectric point according different methods:
Peptides (in silico digests for buttom-up proteomics)
Below you can find in silico digests of the whole proteome with Trypsin, Chymotrypsin, Trypsin+LysC, LysN, ArgC proteases suitable for different mass spec machines.| Try ESI |
 |
|---|
| ChTry ESI |
|
|---|
| ArgC ESI |
|
|---|
| LysN ESI |
|
|---|
| TryLysC ESI |
|
|---|
| Try MALDI |
|
|---|
| ChTry MALDI |
|
|---|
| ArgC MALDI |
|
|---|
| LysN MALDI |
|
|---|
| TryLysC MALDI |
|
|---|
| Try LTQ |
|
|---|
| ChTry LTQ |
|
|---|
| ArgC LTQ |
|
|---|
| LysN LTQ |
|
|---|
| TryLysC LTQ |
|
|---|
| Try MSlow |
|
|---|
| ChTry MSlow |
|
|---|
| ArgC MSlow |
|
|---|
| LysN MSlow |
|
|---|
| TryLysC MSlow |
|
|---|
| Try MShigh |
|
|---|
| ChTry MShigh |
|
|---|
| ArgC MShigh |
|
|---|
| LysN MShigh |
|
|---|
| TryLysC MShigh |
|
|---|
General Statistics
Number of major isoforms |
Number of additional isoforms |
Number of all proteins |
Number of amino acids |
Min. Seq. Length |
Max. Seq. Length |
Avg. Seq. Length |
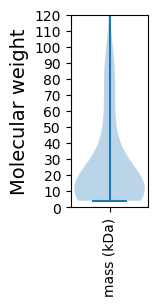
Avg. Mol. Weight |
|---|---|---|---|---|---|---|---|
0 |
12213 |
34 |
1331 |
244.3 |
27.1 |
Amino acid frequency
Ala |
Cys |
Asp |
Glu |
Phe |
Gly |
His |
Ile |
Lys |
Leu |
|---|---|---|---|---|---|---|---|---|---|
9.023 ± 0.414 | 0.909 ± 0.171 |
6.436 ± 0.233 | 6.297 ± 0.307 |
3.75 ± 0.2 | 7.795 ± 0.327 |
1.883 ± 0.183 | 5.036 ± 0.158 |
6.198 ± 0.367 | 8.237 ± 0.233 |
Met |
Asn |
Gln |
Pro |
Arg |
Ser |
Thr |
Val |
Trp |
Tyr |
|---|---|---|---|---|---|---|---|---|---|
2.718 ± 0.158 | 4.553 ± 0.194 |
3.709 ± 0.158 | 4.094 ± 0.346 |
5.306 ± 0.231 | 6.182 ± 0.286 |
6.035 ± 0.289 | 7.115 ± 0.339 |
1.433 ± 0.162 | 3.292 ± 0.165 |
Most of the basic statistics you can see at this page can be downloaded from this CSV file
See this proteome in:

Proteome-pI is available under Creative Commons Attribution-NoDerivs license, for more details see here
| Reference: Kozlowski LP. Proteome-pI 2.0: Proteome Isoelectric Point Database Update. Nucleic Acids Res. 2021, doi: 10.1093/nar/gkab944 | Contact: Lukasz P. Kozlowski |