Turkeypox virus
Taxonomy: Viruses; Varidnaviria; Bamfordvirae; Nucleocytoviricota; Pokkesviricetes; Chitovirales; Poxviridae; Chordopoxvirinae; Avipoxvirus
Average proteome isoelectric point is 6.72
Get precalculated fractions of proteins
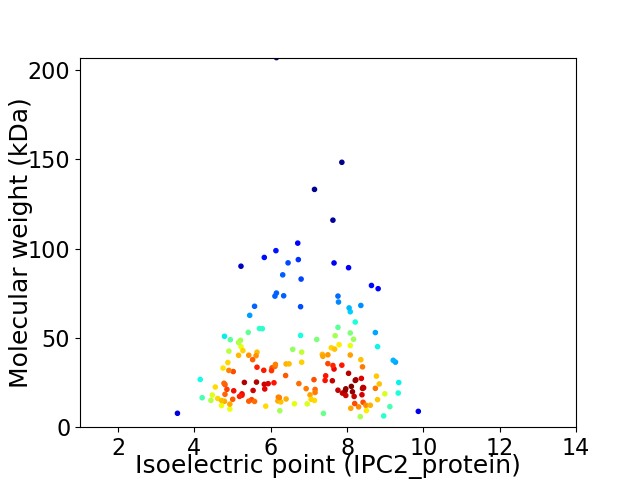
Virtual 2D-PAGE plot for 170 proteins (isoelectric point calculated using IPC2_protein)
Get csv file with sequences according to given criteria:
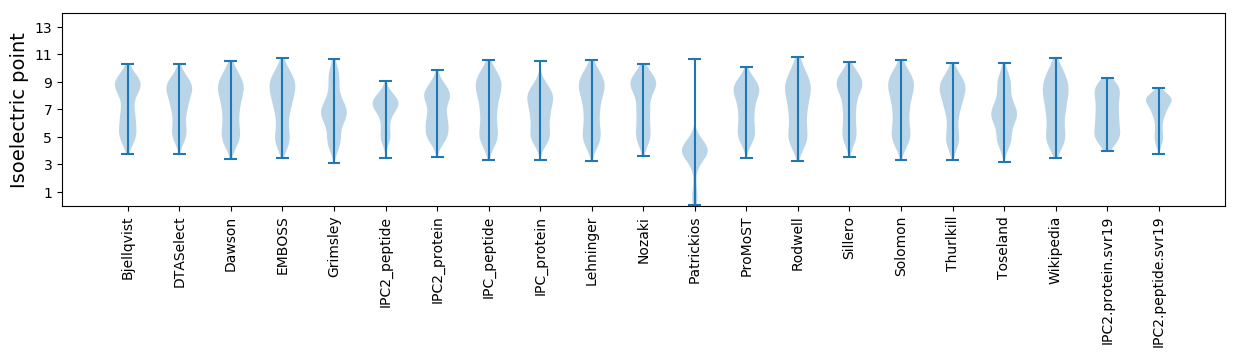
* You can choose from 21 different methods for calculating isoelectric point
Summary statistics related to proteome-wise predictions
Protein with the lowest isoelectric point:
>tr|A0A0M3ZHH4|A0A0M3ZHH4_9POXV TGF-beta-like protein OS=Turkeypox virus OX=336486 PE=3 SV=1
MM1 pKa = 7.89LDD3 pKa = 4.07NINVLLLVAFVSAILIVDD21 pKa = 4.08FDD23 pKa = 3.81IVLYY27 pKa = 10.76AIIFYY32 pKa = 11.12ALLLIFNIDD41 pKa = 3.41PVISVFMLLVSLKK54 pKa = 10.82LVISLNNLLSEE65 pKa = 4.25YY66 pKa = 10.69LIDD69 pKa = 3.96
MM1 pKa = 7.89LDD3 pKa = 4.07NINVLLLVAFVSAILIVDD21 pKa = 4.08FDD23 pKa = 3.81IVLYY27 pKa = 10.76AIIFYY32 pKa = 11.12ALLLIFNIDD41 pKa = 3.41PVISVFMLLVSLKK54 pKa = 10.82LVISLNNLLSEE65 pKa = 4.25YY66 pKa = 10.69LIDD69 pKa = 3.96
Molecular weight: 7.79 kDa
Isoelectric point according different methods:
Protein with the highest isoelectric point:
>tr|A0A0M3ZK19|A0A0M3ZK19_9POXV Uncharacterized protein OS=Turkeypox virus OX=336486 PE=3 SV=1
MM1 pKa = 7.71EE2 pKa = 5.09IAKK5 pKa = 7.99EE6 pKa = 3.97TLIVIGLTILVIILVISGFSLILRR30 pKa = 11.84LIPGVYY36 pKa = 10.05SSVARR41 pKa = 11.84SSFTGGKK48 pKa = 8.87ILRR51 pKa = 11.84FMEE54 pKa = 4.25IFSTLMFIPGIIILYY69 pKa = 9.13AAYY72 pKa = 9.38IRR74 pKa = 11.84KK75 pKa = 8.58FRR77 pKa = 11.84SGNN80 pKa = 3.29
MM1 pKa = 7.71EE2 pKa = 5.09IAKK5 pKa = 7.99EE6 pKa = 3.97TLIVIGLTILVIILVISGFSLILRR30 pKa = 11.84LIPGVYY36 pKa = 10.05SSVARR41 pKa = 11.84SSFTGGKK48 pKa = 8.87ILRR51 pKa = 11.84FMEE54 pKa = 4.25IFSTLMFIPGIIILYY69 pKa = 9.13AAYY72 pKa = 9.38IRR74 pKa = 11.84KK75 pKa = 8.58FRR77 pKa = 11.84SGNN80 pKa = 3.29
Molecular weight: 8.87 kDa
Isoelectric point according different methods:
Peptides (in silico digests for buttom-up proteomics)
Below you can find in silico digests of the whole proteome with Trypsin, Chymotrypsin, Trypsin+LysC, LysN, ArgC proteases suitable for different mass spec machines.| Try ESI |
 |
|---|
| ChTry ESI |
|
|---|
| ArgC ESI |
|
|---|
| LysN ESI |
|
|---|
| TryLysC ESI |
|
|---|
| Try MALDI |
|
|---|
| ChTry MALDI |
|
|---|
| ArgC MALDI |
|
|---|
| LysN MALDI |
|
|---|
| TryLysC MALDI |
|
|---|
| Try LTQ |
|
|---|
| ChTry LTQ |
|
|---|
| ArgC LTQ |
|
|---|
| LysN LTQ |
|
|---|
| TryLysC LTQ |
|
|---|
| Try MSlow |
|
|---|
| ChTry MSlow |
|
|---|
| ArgC MSlow |
|
|---|
| LysN MSlow |
|
|---|
| TryLysC MSlow |
|
|---|
| Try MShigh |
|
|---|
| ChTry MShigh |
|
|---|
| ArgC MShigh |
|
|---|
| LysN MShigh |
|
|---|
| TryLysC MShigh |
|
|---|
General Statistics
Number of major isoforms |
Number of additional isoforms |
Number of all proteins |
Number of amino acids |
Min. Seq. Length |
Max. Seq. Length |
Avg. Seq. Length |
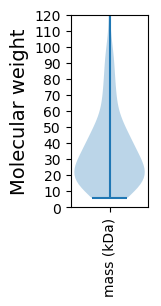
Avg. Mol. Weight |
|---|---|---|---|---|---|---|---|
0 |
55063 |
54 |
1810 |
323.9 |
37.47 |
Amino acid frequency
Ala |
Cys |
Asp |
Glu |
Phe |
Gly |
His |
Ile |
Lys |
Leu |
|---|---|---|---|---|---|---|---|---|---|
3.356 ± 0.105 | 2.185 ± 0.104 |
6.454 ± 0.123 | 5.127 ± 0.106 |
4.444 ± 0.149 | 3.781 ± 0.115 |
1.95 ± 0.058 | 11.24 ± 0.156 |
7.824 ± 0.165 | 9.213 ± 0.179 |
Met |
Asn |
Gln |
Pro |
Arg |
Ser |
Thr |
Val |
Trp |
Tyr |
|---|---|---|---|---|---|---|---|---|---|
2.606 ± 0.067 | 7.826 ± 0.149 |
3.075 ± 0.106 | 1.823 ± 0.082 |
4.03 ± 0.107 | 7.591 ± 0.131 |
5.488 ± 0.103 | 5.376 ± 0.114 |
0.647 ± 0.046 | 5.964 ± 0.125 |
Most of the basic statistics you can see at this page can be downloaded from this CSV file
See this proteome in:

Proteome-pI is available under Creative Commons Attribution-NoDerivs license, for more details see here
| Reference: Kozlowski LP. Proteome-pI 2.0: Proteome Isoelectric Point Database Update. Nucleic Acids Res. 2021, doi: 10.1093/nar/gkab944 | Contact: Lukasz P. Kozlowski |