Sphingobium sp. AP49
Taxonomy: cellular organisms; Bacteria; Proteobacteria; Alphaproteobacteria; Sphingomonadales; Sphingomonadaceae; Sphingobium; unclassified Sphingobium
Average proteome isoelectric point is 6.51
Get precalculated fractions of proteins
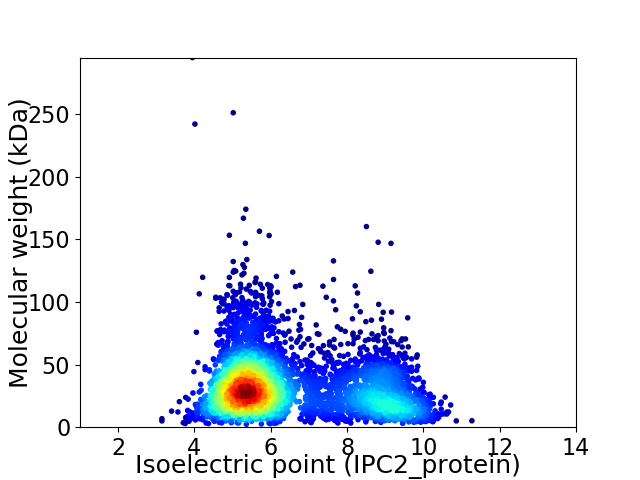
Virtual 2D-PAGE plot for 4212 proteins (isoelectric point calculated using IPC2_protein)
Get csv file with sequences according to given criteria:
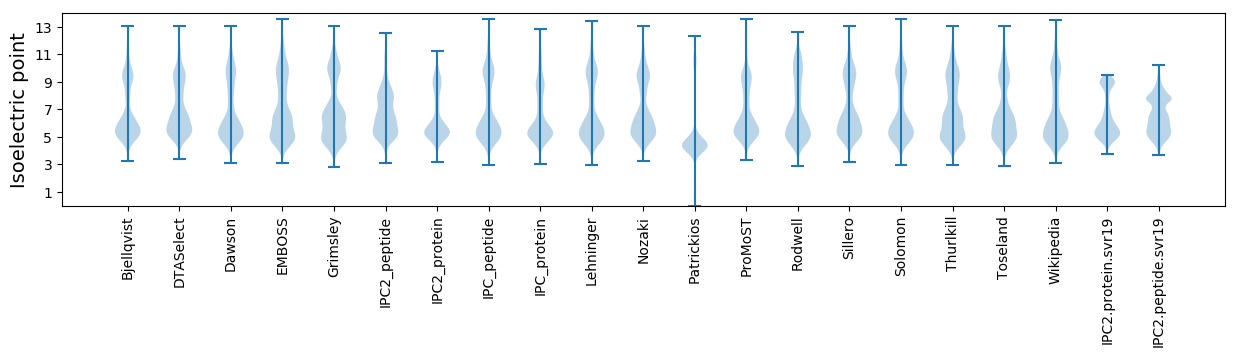
* You can choose from 21 different methods for calculating isoelectric point
Summary statistics related to proteome-wise predictions
Protein with the lowest isoelectric point:
>tr|J2WCN9|J2WCN9_9SPHN Membrane protein involved in the export of O-antigen and teichoic acid OS=Sphingobium sp. AP49 OX=1144307 GN=PMI04_03548 PE=4 SV=1
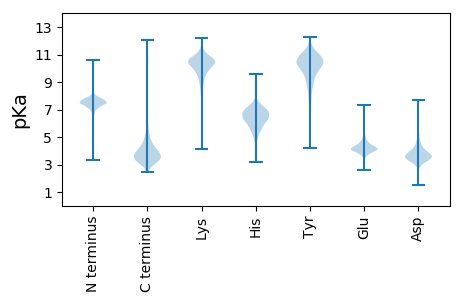
MM1 pKa = 7.38RR2 pKa = 11.84TTYY5 pKa = 11.22DD6 pKa = 3.12SATVRR11 pKa = 11.84LYY13 pKa = 11.04HH14 pKa = 7.0LGDD17 pKa = 5.03DD18 pKa = 4.26GAAMTIMYY26 pKa = 9.73GPLSEE31 pKa = 4.35ALRR34 pKa = 11.84VAEE37 pKa = 4.02QQPQEE42 pKa = 4.22VQDD45 pKa = 4.07GLFLATDD52 pKa = 3.84NDD54 pKa = 3.68VVAYY58 pKa = 10.51LDD60 pKa = 4.88LIEE63 pKa = 4.28SS64 pKa = 3.94
MM1 pKa = 7.38RR2 pKa = 11.84TTYY5 pKa = 11.22DD6 pKa = 3.12SATVRR11 pKa = 11.84LYY13 pKa = 11.04HH14 pKa = 7.0LGDD17 pKa = 5.03DD18 pKa = 4.26GAAMTIMYY26 pKa = 9.73GPLSEE31 pKa = 4.35ALRR34 pKa = 11.84VAEE37 pKa = 4.02QQPQEE42 pKa = 4.22VQDD45 pKa = 4.07GLFLATDD52 pKa = 3.84NDD54 pKa = 3.68VVAYY58 pKa = 10.51LDD60 pKa = 4.88LIEE63 pKa = 4.28SS64 pKa = 3.94
Molecular weight: 7.08 kDa
Isoelectric point according different methods:
Protein with the highest isoelectric point:
>tr|J2D7N9|J2D7N9_9SPHN Putative membrane protein OS=Sphingobium sp. AP49 OX=1144307 GN=PMI04_00679 PE=4 SV=1
MM1 pKa = 7.45KK2 pKa = 9.61RR3 pKa = 11.84TFQPSNLVRR12 pKa = 11.84KK13 pKa = 9.18RR14 pKa = 11.84RR15 pKa = 11.84HH16 pKa = 4.42GFRR19 pKa = 11.84ARR21 pKa = 11.84MATPGGRR28 pKa = 11.84NIMRR32 pKa = 11.84ARR34 pKa = 11.84RR35 pKa = 11.84ARR37 pKa = 11.84GRR39 pKa = 11.84KK40 pKa = 9.07SLSAA44 pKa = 3.93
MM1 pKa = 7.45KK2 pKa = 9.61RR3 pKa = 11.84TFQPSNLVRR12 pKa = 11.84KK13 pKa = 9.18RR14 pKa = 11.84RR15 pKa = 11.84HH16 pKa = 4.42GFRR19 pKa = 11.84ARR21 pKa = 11.84MATPGGRR28 pKa = 11.84NIMRR32 pKa = 11.84ARR34 pKa = 11.84RR35 pKa = 11.84ARR37 pKa = 11.84GRR39 pKa = 11.84KK40 pKa = 9.07SLSAA44 pKa = 3.93
Molecular weight: 5.14 kDa
Isoelectric point according different methods:
Peptides (in silico digests for buttom-up proteomics)
Below you can find in silico digests of the whole proteome with Trypsin, Chymotrypsin, Trypsin+LysC, LysN, ArgC proteases suitable for different mass spec machines.| Try ESI |
 |
|---|
| ChTry ESI |
|
|---|
| ArgC ESI |
|
|---|
| LysN ESI |
|
|---|
| TryLysC ESI |
|
|---|
| Try MALDI |
|
|---|
| ChTry MALDI |
|
|---|
| ArgC MALDI |
|
|---|
| LysN MALDI |
|
|---|
| TryLysC MALDI |
|
|---|
| Try LTQ |
|
|---|
| ChTry LTQ |
|
|---|
| ArgC LTQ |
|
|---|
| LysN LTQ |
|
|---|
| TryLysC LTQ |
|
|---|
| Try MSlow |
|
|---|
| ChTry MSlow |
|
|---|
| ArgC MSlow |
|
|---|
| LysN MSlow |
|
|---|
| TryLysC MSlow |
|
|---|
| Try MShigh |
|
|---|
| ChTry MShigh |
|
|---|
| ArgC MShigh |
|
|---|
| LysN MShigh |
|
|---|
| TryLysC MShigh |
|
|---|
General Statistics
Number of major isoforms |
Number of additional isoforms |
Number of all proteins |
Number of amino acids |
Min. Seq. Length |
Max. Seq. Length |
Avg. Seq. Length |
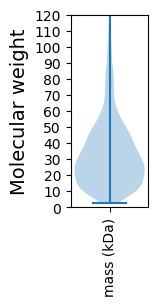
Avg. Mol. Weight |
|---|---|---|---|---|---|---|---|
0 |
1352865 |
21 |
2962 |
321.2 |
34.7 |
Amino acid frequency
Ala |
Cys |
Asp |
Glu |
Phe |
Gly |
His |
Ile |
Lys |
Leu |
|---|---|---|---|---|---|---|---|---|---|
13.283 ± 0.066 | 0.764 ± 0.01 |
6.219 ± 0.03 | 4.899 ± 0.033 |
3.475 ± 0.021 | 8.931 ± 0.037 |
2.055 ± 0.019 | 5.264 ± 0.025 |
3.024 ± 0.026 | 9.942 ± 0.048 |
Met |
Asn |
Gln |
Pro |
Arg |
Ser |
Thr |
Val |
Trp |
Tyr |
|---|---|---|---|---|---|---|---|---|---|
2.585 ± 0.018 | 2.583 ± 0.026 |
5.421 ± 0.029 | 3.37 ± 0.02 |
7.046 ± 0.046 | 5.232 ± 0.036 |
5.213 ± 0.036 | 6.848 ± 0.03 |
1.484 ± 0.017 | 2.362 ± 0.023 |
Most of the basic statistics you can see at this page can be downloaded from this CSV file
See this proteome in:

Proteome-pI is available under Creative Commons Attribution-NoDerivs license, for more details see here
| Reference: Kozlowski LP. Proteome-pI 2.0: Proteome Isoelectric Point Database Update. Nucleic Acids Res. 2021, doi: 10.1093/nar/gkab944 | Contact: Lukasz P. Kozlowski |