Edwardsiella ictaluri (strain 93-146)
Taxonomy: cellular organisms; Bacteria; Proteobacteria; Gammaproteobacteria; Enterobacterales; Hafniaceae; Edwardsiella; Edwardsiella ictaluri
Average proteome isoelectric point is 6.91
Get precalculated fractions of proteins
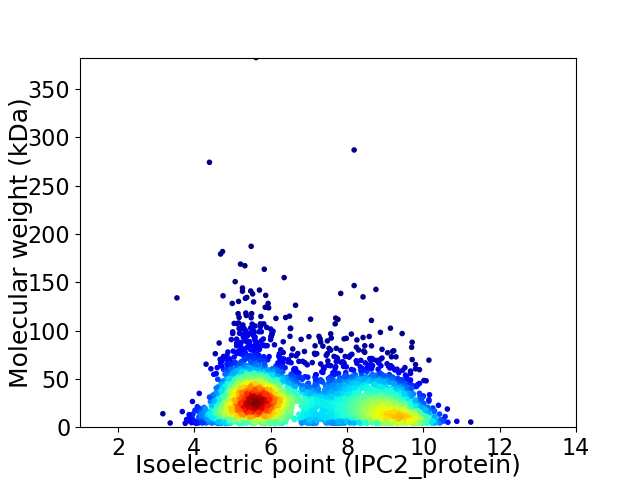
Virtual 2D-PAGE plot for 3686 proteins (isoelectric point calculated using IPC2_protein)
Get csv file with sequences according to given criteria:
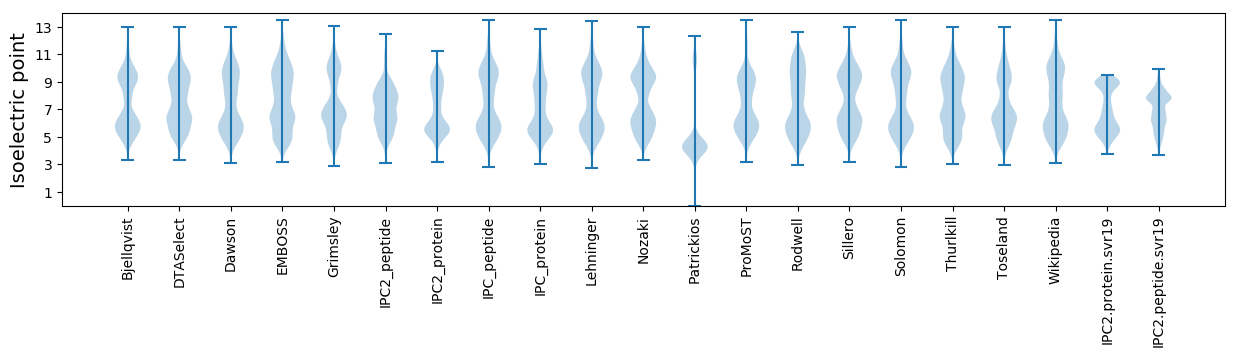
* You can choose from 21 different methods for calculating isoelectric point
Summary statistics related to proteome-wise predictions
Protein with the lowest isoelectric point:
>tr|C5BEQ5|C5BEQ5_EDWI9 DUF3644 domain-containing protein OS=Edwardsiella ictaluri (strain 93-146) OX=634503 GN=NT01EI_3143 PE=4 SV=1
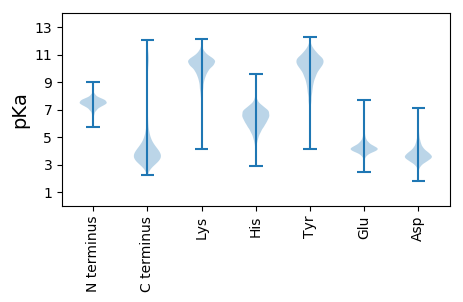
MM1 pKa = 7.29KK2 pKa = 10.16KK3 pKa = 10.09IYY5 pKa = 9.5IHH7 pKa = 7.14KK8 pKa = 10.34DD9 pKa = 2.92NLDD12 pKa = 3.63SYY14 pKa = 10.42TEE16 pKa = 4.11YY17 pKa = 10.36PVPEE21 pKa = 5.01DD22 pKa = 3.3TTDD25 pKa = 2.66WYY27 pKa = 10.13TVDD30 pKa = 3.78VPDD33 pKa = 5.67DD34 pKa = 3.54FTLAGSVYY42 pKa = 9.89NPQIGEE48 pKa = 4.19FDD50 pKa = 3.85TPALPPII57 pKa = 4.37
MM1 pKa = 7.29KK2 pKa = 10.16KK3 pKa = 10.09IYY5 pKa = 9.5IHH7 pKa = 7.14KK8 pKa = 10.34DD9 pKa = 2.92NLDD12 pKa = 3.63SYY14 pKa = 10.42TEE16 pKa = 4.11YY17 pKa = 10.36PVPEE21 pKa = 5.01DD22 pKa = 3.3TTDD25 pKa = 2.66WYY27 pKa = 10.13TVDD30 pKa = 3.78VPDD33 pKa = 5.67DD34 pKa = 3.54FTLAGSVYY42 pKa = 9.89NPQIGEE48 pKa = 4.19FDD50 pKa = 3.85TPALPPII57 pKa = 4.37
Molecular weight: 6.54 kDa
Isoelectric point according different methods:
Protein with the highest isoelectric point:
>tr|C5BF72|C5BF72_EDWI9 DUF1471 domain-containing protein OS=Edwardsiella ictaluri (strain 93-146) OX=634503 GN=NT01EI_0420 PE=4 SV=1
MM1 pKa = 7.45KK2 pKa = 9.51RR3 pKa = 11.84TFQPSVLKK11 pKa = 10.68RR12 pKa = 11.84NRR14 pKa = 11.84THH16 pKa = 7.28GFRR19 pKa = 11.84ARR21 pKa = 11.84MANKK25 pKa = 9.98NGRR28 pKa = 11.84QVLARR33 pKa = 11.84RR34 pKa = 11.84RR35 pKa = 11.84AKK37 pKa = 10.22GRR39 pKa = 11.84ARR41 pKa = 11.84LTVAGG46 pKa = 4.3
MM1 pKa = 7.45KK2 pKa = 9.51RR3 pKa = 11.84TFQPSVLKK11 pKa = 10.68RR12 pKa = 11.84NRR14 pKa = 11.84THH16 pKa = 7.28GFRR19 pKa = 11.84ARR21 pKa = 11.84MANKK25 pKa = 9.98NGRR28 pKa = 11.84QVLARR33 pKa = 11.84RR34 pKa = 11.84RR35 pKa = 11.84AKK37 pKa = 10.22GRR39 pKa = 11.84ARR41 pKa = 11.84LTVAGG46 pKa = 4.3
Molecular weight: 5.32 kDa
Isoelectric point according different methods:
Peptides (in silico digests for buttom-up proteomics)
Below you can find in silico digests of the whole proteome with Trypsin, Chymotrypsin, Trypsin+LysC, LysN, ArgC proteases suitable for different mass spec machines.| Try ESI |
 |
|---|
| ChTry ESI |
|
|---|
| ArgC ESI |
|
|---|
| LysN ESI |
|
|---|
| TryLysC ESI |
|
|---|
| Try MALDI |
|
|---|
| ChTry MALDI |
|
|---|
| ArgC MALDI |
|
|---|
| LysN MALDI |
|
|---|
| TryLysC MALDI |
|
|---|
| Try LTQ |
|
|---|
| ChTry LTQ |
|
|---|
| ArgC LTQ |
|
|---|
| LysN LTQ |
|
|---|
| TryLysC LTQ |
|
|---|
| Try MSlow |
|
|---|
| ChTry MSlow |
|
|---|
| ArgC MSlow |
|
|---|
| LysN MSlow |
|
|---|
| TryLysC MSlow |
|
|---|
| Try MShigh |
|
|---|
| ChTry MShigh |
|
|---|
| ArgC MShigh |
|
|---|
| LysN MShigh |
|
|---|
| TryLysC MShigh |
|
|---|
General Statistics
Number of major isoforms |
Number of additional isoforms |
Number of all proteins |
Number of amino acids |
Min. Seq. Length |
Max. Seq. Length |
Avg. Seq. Length |
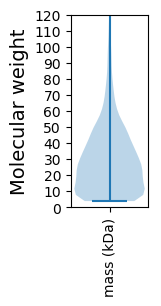
Avg. Mol. Weight |
|---|---|---|---|---|---|---|---|
0 |
1044215 |
37 |
3711 |
283.3 |
31.27 |
Amino acid frequency
Ala |
Cys |
Asp |
Glu |
Phe |
Gly |
His |
Ile |
Lys |
Leu |
|---|---|---|---|---|---|---|---|---|---|
10.46 ± 0.051 | 1.313 ± 0.02 |
5.197 ± 0.034 | 5.052 ± 0.047 |
3.577 ± 0.029 | 7.606 ± 0.047 |
2.416 ± 0.023 | 5.589 ± 0.037 |
3.342 ± 0.045 | 11.479 ± 0.072 |
Met |
Asn |
Gln |
Pro |
Arg |
Ser |
Thr |
Val |
Trp |
Tyr |
|---|---|---|---|---|---|---|---|---|---|
2.72 ± 0.02 | 3.292 ± 0.033 |
4.622 ± 0.034 | 4.915 ± 0.042 |
6.618 ± 0.042 | 5.838 ± 0.035 |
5.02 ± 0.031 | 6.687 ± 0.034 |
1.402 ± 0.019 | 2.854 ± 0.023 |
Most of the basic statistics you can see at this page can be downloaded from this CSV file
See this proteome in:

Proteome-pI is available under Creative Commons Attribution-NoDerivs license, for more details see here
| Reference: Kozlowski LP. Proteome-pI 2.0: Proteome Isoelectric Point Database Update. Nucleic Acids Res. 2021, doi: 10.1093/nar/gkab944 | Contact: Lukasz P. Kozlowski |